Exam 10: Introduction to Statistics
Exam 1: Algebra and Equations409 Questions
Exam 2: Graphs, Lines, and Inequalities255 Questions
Exam 3: Functions and Graphs323 Questions
Exam 4: Exponential and Logarithmic Functions192 Questions
Exam 5: Mathematics of Finance183 Questions
Exam 6: Systems of Linear Equations and Matrices215 Questions
Exam 7: Linear Programming203 Questions
Exam 8: Sets and Probability240 Questions
Exam 9: Counting, Probability Distributions, and Further Topics in Probability210 Questions
Exam 10: Introduction to Statistics169 Questions
Exam 11: Differential Calculus342 Questions
Exam 12: Applications of the Derivative220 Questions
Exam 13: Integral Calculus227 Questions
Exam 14: Multivariate Calculus152 Questions
Select questions type
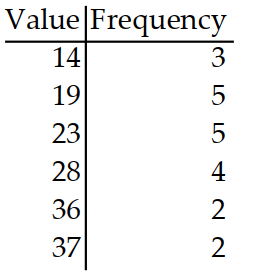
Find the mean for the frequency distribution. Round to the nearest tenth.
-
(Multiple Choice)
4.9/5  (44)
(44)
In a certain distribution, the mean is 50 with a standard deviation of 6 . Use Chebyshev's theorem to tell the probabilitythat a number lies in the following interval. Round your results to the nearest whole percent.
-Between 29 and 71
(Multiple Choice)
4.9/5 (36)
Find a score satisfying the given condition.
- of the total area is to the left of .
(Multiple Choice)
4.8/5 (33)
Solve the problem.
-The stem and leaf plot depicts the scores earned on individual driver tests in the month of July.
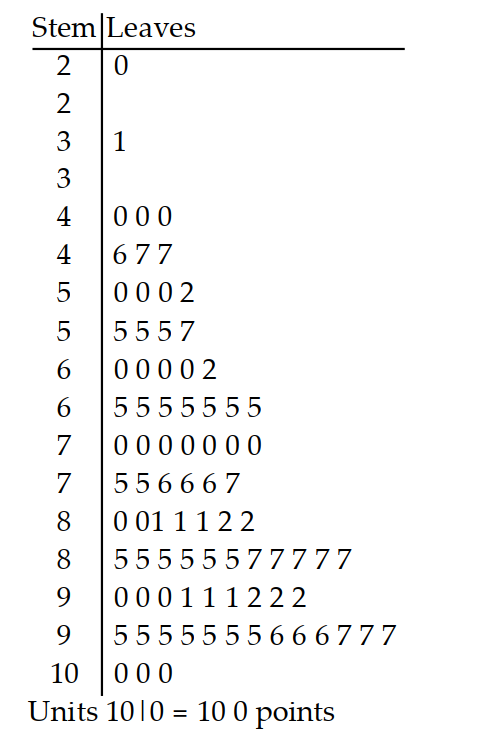 If the minimum passing score is 80 points, how many people passed the driver test?
(Multiple Choice)
4.9/5 (39)
Find the area under the normal curve.
-Find the percent of the area under a normal curve between the mean and 3.01 deviations from the mean.
(Multiple Choice)
4.9/5 (36)
Solve the problem.
-The histogram shows the percentage of residential properties in negative equity or near negative equity for several states. 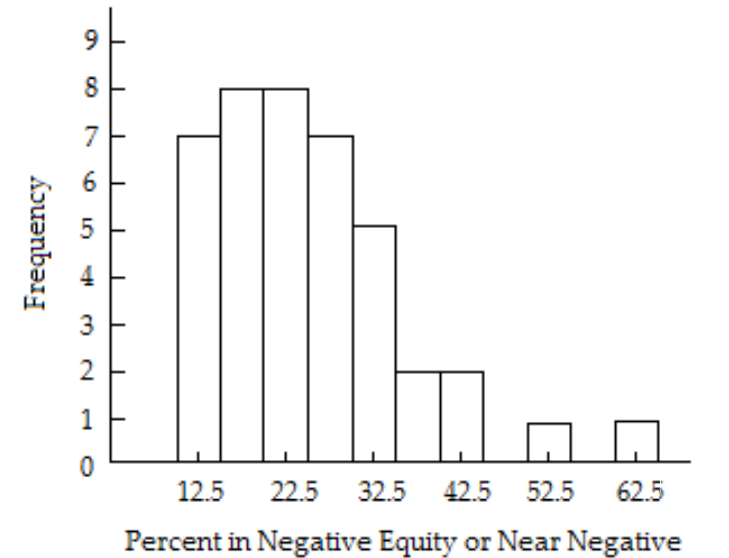 How many states had their percentage above ?
(Multiple Choice)
4.9/5 (25)
Find the standard deviation. Round to the nearest tenth.
-
(Multiple Choice)
4.8/5 (28)
Prepare a frequency distribution for the given data with columns for intervals and frequencies.
-The following is the number of hours students studied per week on average. Use five intervals, starting with .
1 6 13 15 20 21 15 10 9 1
6 12 16 21 18 14 5 10 14 20
(Multiple Choice)
4.9/5 (32)
Solve the problem.
-The histogram shows the percentage of residential properties in negative equity or near negative equity for several states.
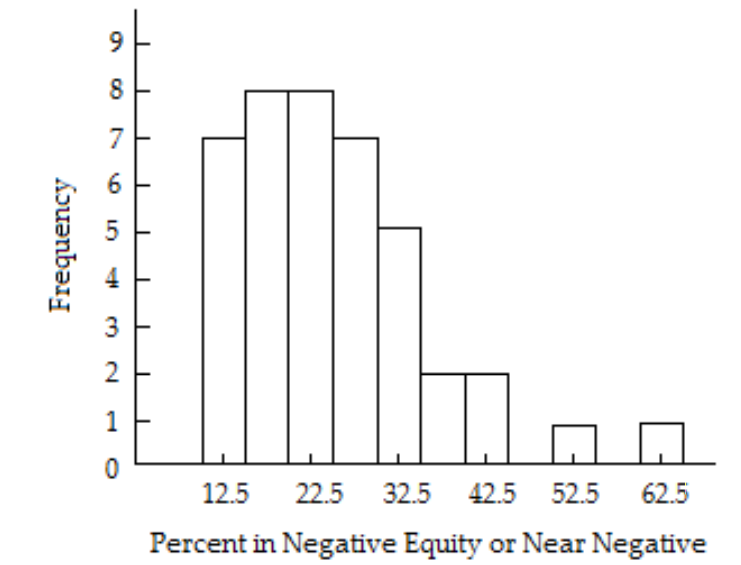 Describe the shape of the distribution.
(Multiple Choice)
4.9/5 (35)
A company installs 5000 light bulbs, each with an average life of 500 hours, standard deviation of 100 hours, anddistribution approximated by a normal curve. Find the approximate number of bulbs that can be expected to last thespecified period of time.
-Between 290 hours and 500 hours
(Multiple Choice)
4.8/5 (38)
Find a score satisfying the given condition.
- of the total area is to the left of .
(Multiple Choice)
4.8/5 (44)
Find the mean for the list of numbers. Round to the nearest tenth.
-
(Multiple Choice)
4.9/5 (37)
Find the standard deviation. Round to the nearest tenth.
-
(Multiple Choice)
4.8/5 (31)
A company installs 5000 light bulbs, each with an average life of 500 hours, standard deviation of 100 hours, anddistribution approximated by a normal curve. Find the approximate number of bulbs that can be expected to last thespecified period of time.
-More than 400 hours
(Multiple Choice)
4.8/5 (37)
Find the mean for the list of numbers. Round to the nearest tenth.
-
(Multiple Choice)
4.9/5 (34)
Find a score satisfying the given condition.
- of the total area is to the right of .
(Multiple Choice)
4.8/5 (32)
Solve the problem.
-The stem and leaf plot depicts the average weight (in pounds) of all four year olds receiving their annual influenza vaccine from the local health clinic.
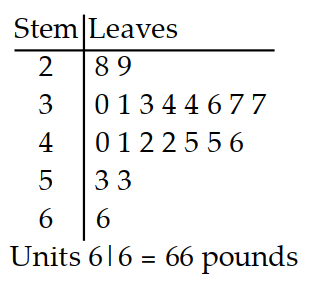 How many children weighed 45 pounds at the time of their influenza vaccine?
(Multiple Choice)
4.9/5 (45)
Find the median.
-The number of vehicles passing through a bank drive-up line during each 15-minute period was recorded. The results are shown below. Find the median number of vehicles going through the line in a fifteen-minute period.
21 23 21 24
24 21 26 23
31 27 27 25
20 27 21 16
1123 23 23
(Multiple Choice)
4.9/5 (39)
Find the median.
-The normal monthly precipitation (in inches) for August is listed for 20 different U.S. cities. Find the median of the data. Round to the nearest hundredth.
3.5 1.6 2.4 3.7 4.1
3.9 1.0 3.6 4.2 3.4
3.7 2.2 1.5 4.2 3.4
2.7 0.4 3.7 2.0 3.6
(Multiple Choice)
4.8/5 (37)
Filters
- Essay(0)
- Multiple Choice(0)
- Short Answer(0)
- True False(0)
- Matching(0)