Exam 10: Introduction to Statistics
Exam 1: Algebra and Equations409 Questions
Exam 2: Graphs, Lines, and Inequalities255 Questions
Exam 3: Functions and Graphs323 Questions
Exam 4: Exponential and Logarithmic Functions192 Questions
Exam 5: Mathematics of Finance183 Questions
Exam 6: Systems of Linear Equations and Matrices215 Questions
Exam 7: Linear Programming203 Questions
Exam 8: Sets and Probability240 Questions
Exam 9: Counting, Probability Distributions, and Further Topics in Probability210 Questions
Exam 10: Introduction to Statistics169 Questions
Exam 11: Differential Calculus342 Questions
Exam 12: Applications of the Derivative220 Questions
Exam 13: Integral Calculus227 Questions
Exam 14: Multivariate Calculus152 Questions
Select questions type
Assume the distribution is normal. Use the area of the normal curve to answer the question. Round to the nearest whole percent.
-The average runner at a local college runs the mile in 4.5 minutes, with a standard deviation of . 3 minutes. What is the probability that a person will run a mile in less than 4 minutes?
(Multiple Choice)
4.8/5  (25)
(25)
At one high school, students can run the 100-yard dash in an average of 15.2 seconds with a standard deviation of .9 seconds. The times are very closely approximated by a normal curve. Find the percent of times that are indicated. Round to the nearest whole percent.
-Greater than 16.1 seconds
(Multiple Choice)
4.8/5 (36)
Construct the specified histogram.
-In a survey, 20 people were asked how many magazines they had purchased during the previous year. The results are shown in the frequency distribution below. Construct a histogram.
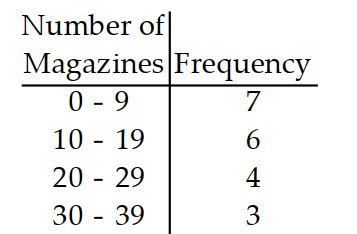
(Essay)
4.9/5 (34)
Find the mean
-The local Tupperware dealers earned commissions last month of , , and .
(Multiple Choice)
4.9/5 (41)
Find the mean for the list of numbers. Round to the nearest tenth.
-
(Multiple Choice)
4.9/5 (33)
Find the standard deviation for the given data.
-To get the best deal on a CD player, Tom called eight appliance stores and asked the cost of a specific model. The prices he was quoted are listed below:
$128 $186 $232 $353 $197 $329 $327 $174
Round results to the nearest ten cents.
(Multiple Choice)
4.9/5 (41)
At one high school, students can run the 100-yard dash in an average of 15.2 seconds with a standard deviation of .9 seconds. The times are very closely approximated by a normal curve. Find the percent of times that are indicated. Round to the nearest whole percent.
-Between 14.3 and 16.1 seconds
(Multiple Choice)
4.8/5 (46)
Find the mean
-Six college buddies bought each other Christmas gifts. They spent , , and . Find the mean amount spent for Christmas gifts.
(Multiple Choice)
4.8/5 (29)
Assume the distribution is normal. Use the area of the normal curve to answer the question. Round to the nearest whole percent.
-A machine produces pencils with an average diameter of .30 inches and a standard deviation of .01 inches. What is the probability of a pencil with a diameter less than .285 inches?
(Multiple Choice)
4.9/5 (41)
At one high school, students can run the 100-yard dash in an average of 15.2 seconds with a standard deviation of .9 seconds. The times are very closely approximated by a normal curve. Find the percent of times that are indicated. Round to the nearest whole percent.
-Between 17 and 17.9 seconds
(Multiple Choice)
4.7/5 (34)
Obtain the five number summary for the given data.
-The weekly salaries (in dollars) of sixteen government workers are listed below.
690 611 813 654
728 576 492 624
530 678 685 460
558 787 513 826
(Multiple Choice)
4.8/5 (50)
Find the standard deviation of the data summarized in the given frequency table.
-The test scores of 40 students are summarized in the frequency table below. Find the standard deviation.
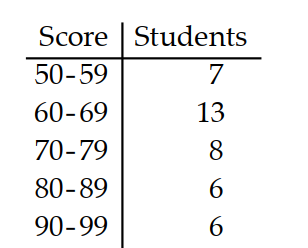
(Multiple Choice)
4.8/5 (39)
Find the mean for the list of numbers. Round to the nearest tenth.
-
(Multiple Choice)
4.8/5 (42)
Construct a boxplot.
-The weights (in pounds) of 30 newborn babies are listed below. Construct a boxplot for the data set.
5.5 5.7 5.8 5.9 6.1 6.1 6.3 6.4 6.5 6.6
6.7 6.7 6.7 6.9 7.0 7.0 7.0 7.1 7.2 7.2
7.4 7.5 7.7 7.7 7.8 8.0 8.1 8.1 8.3 8.7
(Multiple Choice)
4.8/5 (39)
Construct a boxplot.
-The test scores of 32 students are listed below. Construct a boxplot for the data set.
32 37 41 44 46 48 53 55
57 57 59 63 65 66 68 69
70 71 74 74 75 77 78 79
81 82 83 86 89 92 95 99
(Multiple Choice)
4.8/5 (32)
Find the mean
-The weight gains (in pounds) over a one month period of 10 patients on a special diet were: 7.7, . Find the mean. Round your answer to the nearest hundredth.
(Multiple Choice)
4.8/5 (40)
Solve the problem.
-If the life, in years, of a television set is normally distributed with a mean of 30 years and a standard deviation of 5 years, what should be the guarantee period if the company wants less than of the television sets to fail while under warranty?
(Multiple Choice)
4.7/5 (31)
Filters
- Essay(0)
- Multiple Choice(0)
- Short Answer(0)
- True False(0)
- Matching(0)