Exam 10: Introduction to Statistics
Exam 1: Algebra and Equations409 Questions
Exam 2: Graphs, Lines, and Inequalities255 Questions
Exam 3: Functions and Graphs323 Questions
Exam 4: Exponential and Logarithmic Functions192 Questions
Exam 5: Mathematics of Finance183 Questions
Exam 6: Systems of Linear Equations and Matrices215 Questions
Exam 7: Linear Programming203 Questions
Exam 8: Sets and Probability240 Questions
Exam 9: Counting, Probability Distributions, and Further Topics in Probability210 Questions
Exam 10: Introduction to Statistics169 Questions
Exam 11: Differential Calculus342 Questions
Exam 12: Applications of the Derivative220 Questions
Exam 13: Integral Calculus227 Questions
Exam 14: Multivariate Calculus152 Questions
Select questions type
Construct a-stem and leaf display for the given data table.
- 34 12 62 14 63 26
44 21 34 28 44 17
33 19 67 69 56 13
(Essay)
4.7/5  (33)
(33)
Find the mean for the list of numbers. Round to the nearest tenth.
-
(Multiple Choice)
4.9/5 (31)
Solve the problem. Round to the nearest hundredth.
-Using the employment information in the table on Alpha Corporation, find the mean for the grouped data. 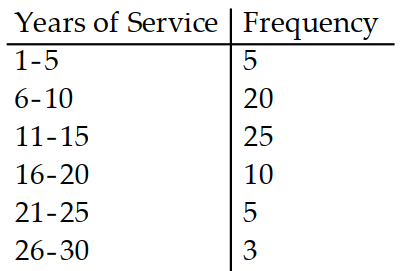
(Multiple Choice)
4.8/5 (39)
Find a score satisfying the given condition.
- of the total area is to the left of .
(Multiple Choice)
4.8/5 (39)
Prepare a frequency distribution for the given data with columns for intervals and frequencies.
-A medical research team studied the ages of patients who had strokes caused by stress. The ages of 34 patients who suffered stress strokes were as follows. Use 8 intervals starting with 25-29.
29 30 36 41 45 50 57 61 28 50 36 58
60 38 36 47 40 32 58 46 61 40 55 32
61 56 45 46 62 36 38 40 50 27
(Multiple Choice)
4.9/5 (38)
A company installs 5000 light bulbs, each with an average life of 500 hours, standard deviation of 100 hours, anddistribution approximated by a normal curve. Find the approximate number of bulbs that can be expected to last thespecified period of time.
-At least 500 hours
(Multiple Choice)
4.8/5 (41)
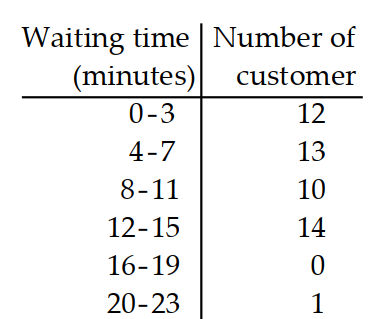
Find the standard deviation of the data summarized in the given frequency table.
-The manager of a bank recorded the amount of time each customer spent waiting in line during peak business hours one Monday. The frequency table below summarizes the results. Find the standard deviation. Round your answer to one decimal place.
(Multiple Choice)
4.9/5 (35)
Assume the distribution is normal. Use the area of the normal curve to answer the question. Round to the nearest whole percent.
-The average weekly income of teachers in one state is with a standard deviation of . What is the probability of a teacher earning more than a week?
(Multiple Choice)
4.8/5 (44)
Solve the problem.
-Find the percent of the area under the standard normal curve between and .
(Multiple Choice)
4.8/5 (43)
Find a score satisfying the given condition.
- of the total area is to the right of .
(Multiple Choice)
4.8/5 (41)
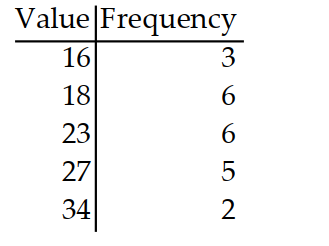
Find the mean for the frequency distribution. Round to the nearest tenth.
-
(Multiple Choice)
4.9/5 (33)
Assume the distribution is normal. Use the area of the normal curve to answer the question. Round to the nearest whole percent.
-A machine fills quart soda bottles with an average of per bottle, with a standard deviation of . What is the probability that a filled bottle will contain less than ?
(Multiple Choice)
4.9/5 (29)
Solve the problem.
-The life span of a certain type of car timing belt, calculated in miles, is normally distributed, with a mean of 80,000 miles and a standard deviation of 6500 miles. If the maker of the timing belt wants less than of the belts to fail while under warranty, for how many miles should the timing belts be guaranteed?
(Multiple Choice)
4.9/5 (43)
Construct the specified histogram.
-The frequency table below shows the number of days off in a given year for 30 police detectives.
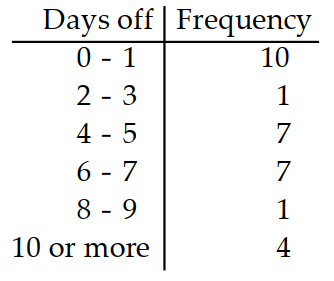 Construct a histogram.
(Essay)
4.8/5 (46)
Find a score satisfying the given condition.
- of the total area is to the right of .
(Multiple Choice)
4.9/5 (41)
Filters
- Essay(0)
- Multiple Choice(0)
- Short Answer(0)
- True False(0)
- Matching(0)