Exam 17: Hypothesis Testing Related to Differences
Exam 1: Introduction to Marketing Research84 Questions
Exam 2: Defining the Marketing Research Problem and Developing an Approach88 Questions
Exam 3: Research Design91 Questions
Exam 4: Exploratory Research Design: Secondary Data69 Questions
Exam 5: Exploratory Research Design: Syndicated Sources of Secondary Data91 Questions
Exam 6: Exploratory Research Design: Qualitative Research94 Questions
Exam 7: Descriptive Research Design: Survey and Observation96 Questions
Exam 8: Causal Research Design: Experimentation102 Questions
Exam 9: Measurement and Scaling: Fundamentals and Comparative Scaling98 Questions
Exam 10: Measurement and Scaling: Noncomparative Scaling Techniques97 Questions
Exam 11: Questionnaire and Form Design92 Questions
Exam 12: Sampling: Design and Procedures90 Questions
Exam 13: Sampling: Final and Initial Sample Size Determination88 Questions
Exam 14: Fieldwork: Data Collection91 Questions
Exam 15: Data Preparation and Analysis Strategy91 Questions
Exam 16: Frequency Distribution,hypothesis Testing,and Cross-Tabulation92 Questions
Exam 17: Hypothesis Testing Related to Differences88 Questions
Exam 18: Correlation and Regression91 Questions
Exam 19: Report Preparation and Presentation89 Questions
Select questions type
A(n)________ is commonly used for the purpose of providing inferences for making statements about the means of parent populations.
(Multiple Choice)
4.9/5  (32)
(32)
A univariate hypothesis test using the t distribution,which is used when the standard deviation is unknown and the sample size is small,is called the z-test.
(True/False)
4.9/5 (36)
Which would be the appropriate way to test differences in proportions for more than two samples?
(Multiple Choice)
4.7/5 (29)
The critical values for a two-tailed z-test,given a significance level of 0.05,would be ________.
(Multiple Choice)
4.9/5 (34)
In its simplest form,ANOVA must have a(n)________ that is metric.
(Multiple Choice)
4.8/5 (38)
According to the text,samples drawn randomly from different populations are termed ________.
(Multiple Choice)
4.8/5 (36)
The most popular parametric test is the ________ conducted for examining hypotheses about means.
(Multiple Choice)
4.9/5 (38)
A frequency distribution that depends on two sets of degrees of freedom is called a(n)________.
(Multiple Choice)
4.9/5 (35)
According to the text,samples drawn randomly from different populations are termed independent samples.
(True/False)
4.9/5 (35)
The most popular parametric test is the t-test conducted for examining hypotheses about means.
(True/False)
4.7/5 (33)
In its simplest form,ANOVA must have a dependent variable that is metric.
(True/False)
4.7/5 (29)
A t-test of sample variance may be performed if it is not known whether the two populations have equal variance.
(True/False)
4.8/5 (36)
Which of the following is the first step in hypothesis testing based on the t statistic?
(Multiple Choice)
4.8/5 (29)
The ________ is a statistic that assumes that the variable has a symmetric bell-shaped distribution and the mean is known,and the population variance is estimated from the sample.
(Multiple Choice)
4.7/5 (37)
According to the text,the t distribution is similar to the ________ in appearance.
(Multiple Choice)
4.8/5 (33)
Significance of the overall effect indicates that some differences exist between some of the treatment groups.
(True/False)
4.7/5 (26)
In the case of conducting the t-test on the means of two samples of observations,the samples can be independent or paired.
(True/False)
4.9/5 (37)
The categorical independent variables used in an analysis of variance are called factors.
(True/False)
5.0/5 (39)
The null hypothesis of equal means for more than two samples is tested by a(n)________,which is the ratio of the mean square related to the independent variable to the mean square related to error.
(Multiple Choice)
5.0/5 (32)
Recently,the competition between Kodak and Fuji has been intensifying.Kodak has reportedly been analyzing films made by Fuji,and Sam's Choice to determine the secrets of these other brands supposedly bright colors.As part of an analysis,a random sample of camera film from Kodak,Fuji,and Sam's Choice was used to take photos under identical light conditions.The film was developed under identical conditions and then tested photochemically to determine photo brightness.With higher values indicating brighter film,do the three brands of film have the same brightness? State the hypotheses for this test.Show your work.
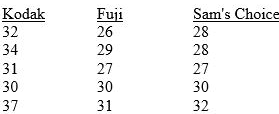 Sum of Squares df Mean Square F Sig. Between 53.733 Groups 64.000 .026 Within Groups 117.733 Total
(Essay)
5.0/5 (35)
Filters
- Essay(0)
- Multiple Choice(0)
- Short Answer(0)
- True False(0)
- Matching(0)