Exam 7: Estimation: Single Population
Exam 1: Describing Data: Graphical247 Questions
Exam 2: Describing Data: Numerical326 Questions
Exam 3: Probability345 Questions
Exam 4: Discrete Random Variables and Probability Distributions257 Questions
Exam 5: Continuous Random Variables and Probability Distributions239 Questions
Exam 6: Sampling and Sampling Distributions147 Questions
Exam 7: Estimation: Single Population151 Questions
Exam 8: Estimation: Additional Topics109 Questions
Exam 9: Hypothesis Testing: Single Population164 Questions
Exam 10: Hypothesis Testing: Additional Topics103 Questions
Exam 11: Simple Regression217 Questions
Exam 12: Multiple Regression252 Questions
Exam 13: Additional Topics in Regression Analysis168 Questions
Exam 14: Analysis of Categorical Data241 Questions
Exam 15: Analysis of Variance192 Questions
Exam 16: Time-Series Analysis and Forecasting138 Questions
Exam 17: Additional Topics in Sampling110 Questions
Select questions type
THE NEXT QUESTIONS ARE BASED ON THE FOLLOWING INFORMATION:
Suppose that the waiting times for patients at a local hospital are normally distributed with known population standard deviation of 30 minutes.A random sample of 75 patients in the local hospital had a mean time of 90 minutes.Assume a 95% confidence interval for the population mean μ.
-Calculate the width of the 95% confidence interval estimate.
(Multiple Choice)
5.0/5  (42)
(42)
Keeping all other factors constant,the more the population standard deviation is reduced,the smaller the margin of error.
(True/False)
4.8/5 (41)
In order to estimate the average daily down time,a manufacturer randomly sampled 41 days of production records and found a mean of 51.75 minutes and standard deviation of 7.9 minutes.A 90% confidence interval for the population mean is:
(Multiple Choice)
4.7/5 (41)
THE NEXT QUESTIONS ARE BASED ON THE FOLLOWING INFORMATION:
A furniture mover calculates the actual weight as a proportion of estimated weight for a sample of 31 recent jobs.The sample mean is 1.13 and the sample standard deviation is 0.16.
-Are the 95% confidence intervals for the population mean,using t tables and using the z table assuming that the population standard deviation is known to be 0.16,of roughly similar size? Explain.
(Essay)
4.7/5 (33)
THE NEXT QUESTIONS ARE BASED ON THE FOLLOWING INFORMATION:
A process producing bricks is known to produce bricks whose weights are normally distributed with a standard deviation of 0.11 lb.A random sample of 16 bricks from today's output had a mean weight of 4.08 lb.
-Find a 99% confidence interval for the mean weight of all bricks produced this day.
(Essay)
4.9/5 (43)
THE NEXT QUESTIONS ARE BASED ON THE FOLLOWING INFORMATION:
Suppose that the amount of time teenagers spend on the internet is normally distributed with a standard deviation of 1.5 hours.A sample of 100 teenagers is selected at random,and the sample mean is computed as 6.5 hours.
-Interpret what the 95% confidence interval estimate of the population mean tells you.
(Essay)
4.7/5 (37)
The number of bolts produced each hour from a particular machine is normally distributed with a standard deviation of 7.4.For a random sample of 15 hours,the average number of bolts produced was 587.3.Find the upper and lower confidence limits of a 98% confidence interval for the population mean number of bolts produced per hour.
(Essay)
4.8/5 (26)
THE NEXT QUESTIONS ARE BASED ON THE FOLLOWING INFORMATION:
A regional CPA firm conducted an audit for a discount chain.One part of the audit involved developing an estimate for the mean dollar error in total charges that occur during the checkout process.They wish to develop a 90% confidence interval estimate for the population mean.A simple random sample of n = 20 is selected,with the following data (in dollars):
 -Calculate the sample mean.
(Essay)
4.8/5 (41)
The number of television sets produced from an assembly line each day is known to have a standard deviation of 17.4 sets per day.The production line averaged 452.3 sets per day for 20 randomly selected days.Which of the following represents a 95% confidence interval for the population mean number of sets per hour?
(Multiple Choice)
5.0/5 (45)
Interval estimates for the variance of a normal population rely on the random variable (n - 1)s2 / σ2,which follows:
(Multiple Choice)
4.9/5 (28)
THE NEXT QUESTIONS ARE BASED ON THE FOLLOWING INFORMATION:
Suppose that the waiting times for patients at a local hospital are normally distributed with known population standard deviation of 30 minutes.A random sample of 75 patients in the local hospital had a mean time of 90 minutes.Assume a 95% confidence interval for the population mean μ.
-What is the formula used to calculate the standard error?
(Multiple Choice)
4.8/5 (52)
THE NEXT QUESTIONS ARE BASED ON THE FOLLOWING INFORMATION:
A Monte Carlo study involves 10,000 random samples of size 20 from a normal population with mean μ = 120 and standard deviation σ = 20.For each sample,the mean and the median are calculated,with the following results:
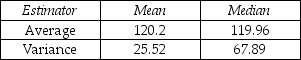 -What does the study suggest about the bias of the estimators in this situation?
(Essay)
4.8/5 (32)
If a sample has 20 observations and a 90% confidence estimate for μ is needed,the appropriate t-score is:
(Multiple Choice)
4.9/5 (40)
THE NEXT QUESTIONS ARE BASED ON THE FOLLOWING INFORMATION:
A regional CPA firm conducted an audit for a discount chain.One part of the audit involved developing an estimate for the mean dollar error in total charges that occur during the checkout process.They wish to develop a 90% confidence interval estimate for the population mean.A simple random sample of n = 20 is selected,with the following data (in dollars):
-The number of television sets coming off a production line each day is known to have a standard deviation of 118.5 sets per day.The production manager tells you that the 90% confidence interval for the population mean was 552.3 to 621.9.How large a sample was this confidence interval based on?
(Essay)
4.8/5 (37)
THE NEXT QUESTIONS ARE BASED ON THE FOLLOWING INFORMATION:
A random sample of ten homes in a particular suburb had the following selling prices (in thousands of dollars): 92,83,110,115,108,96,102,90,100,and 98.
-Check for evidence of nonnormality.
(Essay)
4.9/5 (38)
THE NEXT QUESTIONS ARE BASED ON THE FOLLOWING INFORMATION:
A process producing bricks is known to produce bricks whose weights are normally distributed with a standard deviation of 0.11 lb.A random sample of 16 bricks from today's output had a mean weight of 4.08 lb.
-Without doing the calculations,explain whether a 95% confidence interval for the mean weight of all bricks produced this day would be wider than,narrower than,or the same width as that of a 99% confidence interval.
(Essay)
4.7/5 (27)
THE NEXT QUESTIONS ARE BASED ON THE FOLLOWING INFORMATION:
The sales manager for a hardware wholesaler finds that 229 of the previous 500 calls to hardware store owners resulted in new product placements.Assume that the 500 calls represent a random sample.
-Give a careful verbal interpretation of the 95% confidence interval for the long-run proportion of new product placements.
(Essay)
4.8/5 (39)
A point estimator  1 is said to be more efficient than a point estimator
  2 if Var(
  1)> Var(
  2).
2).
(True/False)
4.8/5 (43)
THE NEXT QUESTIONS ARE BASED ON THE FOLLOWING INFORMATION:
A furniture mover calculates the actual weight as a proportion of estimated weight for a sample of 31 recent jobs.The sample mean is 1.13 and the sample standard deviation is 0.16.
-Calculate a 95% confidence interval for the population mean using t tables.
(Essay)
4.8/5 (35)
THE NEXT QUESTIONS ARE BASED ON THE FOLLOWING INFORMATION:
Let X1,X2,X3,and X4 be a random sample of observations from a population with mean μ and variance σ2.Consider the following two point estimators of μ:  1 = 0.10 X1 + 0.40 X2 + 0.40 X3 + 0.10 X4 and
  2 = 0.20 X1 + 0.30 X2 + 0.30 X3 + 0.20 X4
-Which of the following constraints is true?
2 = 0.20 X1 + 0.30 X2 + 0.30 X3 + 0.20 X4
-Which of the following constraints is true?
(Multiple Choice)
4.7/5 (36)
Filters
- Essay(0)
- Multiple Choice(0)
- Short Answer(0)
- True False(0)
- Matching(0)