Exam 7: Estimation: Single Population
Exam 1: Describing Data: Graphical247 Questions
Exam 2: Describing Data: Numerical326 Questions
Exam 3: Probability345 Questions
Exam 4: Discrete Random Variables and Probability Distributions257 Questions
Exam 5: Continuous Random Variables and Probability Distributions239 Questions
Exam 6: Sampling and Sampling Distributions147 Questions
Exam 7: Estimation: Single Population151 Questions
Exam 8: Estimation: Additional Topics109 Questions
Exam 9: Hypothesis Testing: Single Population164 Questions
Exam 10: Hypothesis Testing: Additional Topics103 Questions
Exam 11: Simple Regression217 Questions
Exam 12: Multiple Regression252 Questions
Exam 13: Additional Topics in Regression Analysis168 Questions
Exam 14: Analysis of Categorical Data241 Questions
Exam 15: Analysis of Variance192 Questions
Exam 16: Time-Series Analysis and Forecasting138 Questions
Exam 17: Additional Topics in Sampling110 Questions
Select questions type
In developing an interval estimate for a population mean,the population standard deviation σ is assumed to be 8.The interval estimate is 45.82 ± 2.36.What will be the interval estimate for the population mean if σ is equal to 16?
(Multiple Choice)
4.8/5  (41)
(41)
The larger the sampling error,the smaller the sample size needed to develop the confidence interval.
(True/False)
4.8/5 (42)
THE NEXT QUESTIONS ARE BASED ON THE FOLLOWING INFORMATION:
Suppose that the waiting times for patients at a local hospital are normally distributed with known population standard deviation of 30 minutes.A random sample of 75 patients in the local hospital had a mean time of 90 minutes.Assume a 95% confidence interval for the population mean μ.
-Calculate the standard error of the 95% confidence interval.
(Multiple Choice)
4.7/5 (37)
THE NEXT QUESTIONS ARE BASED ON THE FOLLOWING INFORMATION:
The Daytona Beach Tourism Commission is interested in the average amount of money a typical college student spends per day during spring break.They survey 35 students and find that the mean spending is $63.57 with a standard deviation of $17.32.
-Interpret the 95% confidence level for the population mean daily spending.
(Essay)
4.8/5 (38)
THE NEXT QUESTIONS ARE BASED ON THE FOLLOWING INFORMATION:
A regional CPA firm conducted an audit for a discount chain.One part of the audit involved developing an estimate for the mean dollar error in total charges that occur during the checkout process.They wish to develop a 90% confidence interval estimate for the population mean.A simple random sample of n = 20 is selected,with the following data (in dollars):
 -In a recent survey of personnel directors,71% thought that they should hire new personnel over the next three months.The researcher conducting the survey reported that the 99% confidence interval for the proportion of all personnel directors planning to hire personnel over the next three months was from 0.68 to 0.74.What is the sample size taken by the researcher?
(Essay)
4.8/5 (34)
The margin of error can be reduced by decreasing the sample size.
(True/False)
5.0/5 (42)
Find the lower confidence limit of the 95% confidence interval.
(Multiple Choice)
4.9/5 (40)
Find the lower confidence limit of the 99% confidence interval.
(Multiple Choice)
4.9/5 (37)
The 95% confidence interval for the population proportion P,given a sample size n = 2200 and sample proportion  = 0.214 is computed as:
(Multiple Choice)
4.9/5 (32)
THE NEXT QUESTIONS ARE BASED ON THE FOLLOWING INFORMATION:
Let X1,X2,X3,and X4 be a random sample of observations from a population with mean μ and variance σ2.Consider the following two point estimators of μ:  1 = 0.10 X1 + 0.40 X2 + 0.40 X3 + 0.10 X4 and
  2 = 0.20 X1 + 0.30 X2 + 0.30 X3 + 0.20 X4
-Which of the following statements is true?
2 = 0.20 X1 + 0.30 X2 + 0.30 X3 + 0.20 X4
-Which of the following statements is true?
(Multiple Choice)
4.9/5 (42)
THE NEXT QUESTIONS ARE BASED ON THE FOLLOWING INFORMATION:
The sales manager for a hardware wholesaler finds that 229 of the previous 500 calls to hardware store owners resulted in new product placements.Assume that the 500 calls represent a random sample.
-Find a 95% confidence interval for the long-run proportion of new product placements.
(Essay)
4.9/5 (41)
A point estimate is an estimate of a population parameter expressed as a single numerical value.
(True/False)
4.9/5 (40)
The amount of material used in making a custom sail for a sailboat is normally distributed with a standard deviation of 64 square feet.For a random sample of 15 sails,the mean amount of material used is 912 square feet.Which of the following represents a 99% confidence interval for the population mean amount of material used in a custom sail?
(Multiple Choice)
4.8/5 (40)
THE NEXT QUESTIONS ARE BASED ON THE FOLLOWING INFORMATION:
Suppose that x1 and x2 are random samples of observations from a population with mean μ and variance σ2.Consider the following three point estimators,X,Y,and Z,of μ: X = (x1 + x2)/2,Y = (x1 + 3x2)/4,and Z = (x1 + 2x2)/3.
-Show that all three estimators X,Y,and Z are unbiased.
(Essay)
4.7/5 (33)
The process of inferring the values of unknown population parameters from those of known sample statistics is called estimation.
(True/False)
4.9/5 (29)
THE NEXT QUESTIONS ARE BASED ON THE FOLLOWING INFORMATION:
A computer is programmed to draw 1000 samples,each of size 40 from a normally distributed population having mean 50 and standard deviation 10.For each sample,the mean and the median are computed.The average value and standard deviation of each set of estimates for the 1000 samples are as follows.
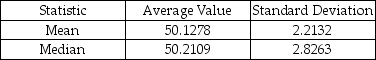 -Do the two statistics appear to be unbiased?
(Essay)
5.0/5 (34)
In a recent survey of 600 adults,16.4% indicated that they had fallen asleep in front of the television in the past month.Which of the following intervals represents a 98% confidence interval for the population proportion?
(Multiple Choice)
4.9/5 (31)
THE NEXT QUESTIONS ARE BASED ON THE FOLLOWING INFORMATION:
Suppose that x1 and x2 are random samples of observations from a population with mean μ and variance σ2.Consider the following three point estimators,X,Y,and Z,of μ: X = (x1 + x2)/2,Y = (x1 + 3x2)/4,and Z = (x1 + 2x2)/3.
-Find the relative efficiency of X with respect to each of the other two estimators Y and Z.
(Essay)
4.9/5 (44)
THE NEXT QUESTIONS ARE BASED ON THE FOLLOWING INFORMATION:
The data shown below specify how much a sample of 20 executives paid in federal income taxes,as a percentage of gross income,are reproduced below.
 Assume that the standard deviation for the underlying population is equal to 4.0.
-Calculate a 99% confidence interval for the population mean.
Assume that the standard deviation for the underlying population is equal to 4.0.
-Calculate a 99% confidence interval for the population mean.
(Essay)
4.7/5 (40)
Filters
- Essay(0)
- Multiple Choice(0)
- Short Answer(0)
- True False(0)
- Matching(0)