Exam 1: Describing Data: Graphical
Why is a cumulative relative frequency distribution so much more informative than just the relative frequency distribution?
Cumulative relative frequency distributions not only tell us the proportions or percentages in the sample or population less than a certain value,but we can take the differences and find the actual cumulative relative frequencies in each class from this distribution.Moreover,as long as we know the total sample or population size,you can get the actual frequencies as well.
The field of statistics can be roughly subdivided into two areas: descriptive statistics and probability.
False
Suppose you were interested in determining the average monthly expenditures of college students on DVDs.How would you define the population for this problem? How would you obtain sample data for this study? Why would you want to ensure that you survey a random sample of college students?
We might be interested in determining these expenditures for all students currently enrolled in a four-year institution of higher learning in the United States.We would want to collect a random sample such that each of the thousands of students in the population is equally likely to be selected.We would not just want to study the expenditures of students at a private college,as their expenditures may be quite different from those of students in public colleges.
A researcher used a procedure to select a sample of n objects from a population in such a way that each member of the population is chosen strictly by chance,is equally likely to be chosen,and every possible sample of size n has the same chance of selection.The procedure used by the researcher is known as:
An observed subset of the population that is usually selected for analysis is called:
What type of graph does a stem-and-leaf resemble when turned vertically?
A parameter is a numerical measure that describes a specific characteristic of a sample.
All graphic representations of sets of data need to be completely self-explanatory.That includes a descriptive meaningful title and identification of the vertical and horizontal scales.
THE NEXT QUESTIONS ARE BASED ON THE FOLLOWING INFORMATION:
Percentage returns for the 25 largest U.S.common stock mutual funds for a particular day are displayed below.
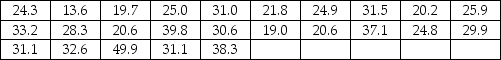 -Construct an ogive to describe the data.
A frequency distribution of numerical data differs from a frequency distribution for categorical data in that a frequency distribution for numerical data:
THE NEXT QUESTIONS ARE BASED ON THE FOLLOWING INFORMATION:
The head of human resources at a corporation with 100 employees was curious about levels of employment by classification.She determined that 10% of all employees were classified as executive,15% as professional,25% as clerical and janitorial,30% as administrative and 20% as technical workers:
-Construct a pie chart to show this information.
When data is collected using a qualitative,nominal variable,what is true about a frequency distribution that summarizes the data?
THE NEXT QUESTIONS ARE BASED ON THE FOLLOWING INFORMATION:
The data in the next table indicate the number of degrees awarded from 2002 to 2008 by degree type at a four-year university in Utah.
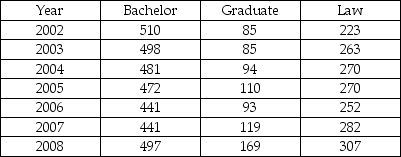 -Graph the data with a time-series plot.
In completing a survey,respondents use the following number codes to indicate ages.
1 = Age 19 years and under,
2 = 20 to 29 years of age
3 = 30 to 39 years of age,
4 = Age 40 years and older
Is this data qualitative or quantitative? Explain.
THE NEXT QUESTIONS ARE BASED ON THE FOLLOWING INFORMATION:
In a recent marketing experiment,consumers were given one of four different types of dishwashing detergent and asked to use it for a month.At the end of that time they were asked to rate the detergent in terms of overall quality.The results are presented below.
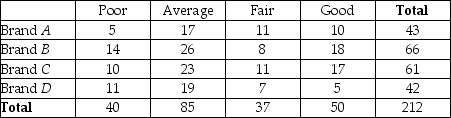 -Of the customers who rated their detergent good,what percentage evaluated Brand C?
Jersey numbers of basketball players are an example of the ordinal scale data.
Filters
- Essay(0)
- Multiple Choice(0)
- Short Answer(0)
- True False(0)
- Matching(0)