Exam 11: Simple Regression
Exam 1: Describing Data: Graphical247 Questions
Exam 2: Describing Data: Numerical326 Questions
Exam 3: Probability345 Questions
Exam 4: Discrete Random Variables and Probability Distributions257 Questions
Exam 5: Continuous Random Variables and Probability Distributions239 Questions
Exam 6: Sampling and Sampling Distributions147 Questions
Exam 7: Estimation: Single Population151 Questions
Exam 8: Estimation: Additional Topics109 Questions
Exam 9: Hypothesis Testing: Single Population164 Questions
Exam 10: Hypothesis Testing: Additional Topics103 Questions
Exam 11: Simple Regression217 Questions
Exam 12: Multiple Regression252 Questions
Exam 13: Additional Topics in Regression Analysis168 Questions
Exam 14: Analysis of Categorical Data241 Questions
Exam 15: Analysis of Variance192 Questions
Exam 16: Time-Series Analysis and Forecasting138 Questions
Exam 17: Additional Topics in Sampling110 Questions
Select questions type
THE NEXT QUESTIONS ARE BASED ON THE FOLLOWING INFORMATION:
A sample of 8 households was asked about their monthly income (x)and the number of hours they spend connected to the internet each month (y).The data yield the following statistics:  ,
,  ,
, 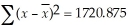 ,
, 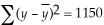 ,
, 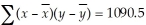 -What is the y-intercept of the regression line of hours on income?
Free
(Multiple Choice)
4.9/5  (47)
(47)
Correct Answer: Verified
D
The value of the correlation coefficient is:
Free
(Multiple Choice)
4.9/5 (29)
Correct Answer:Verified
B
THE NEXT QUESTIONS ARE BASED ON THE FOLLOWING INFORMATION:
A sample of 8 households was asked about their monthly income (x)and the number of hours they spend connected to the internet each month (y).The data yield the following statistics:
,
,
,
,
-Compute the standard error of the slope of the regression line of hours on income.
Free
(Multiple Choice)
4.8/5 (31)
Correct Answer:Verified
C
THE NEXT QUESTIONS ARE BASED ON THE FOLLOWING INFORMATION:
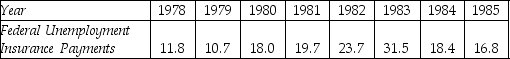
The data below are for the number of unemployed persons (in millions)and the federal unemployment insurance payments (in billions of dollars)for the years 1978-1985.Some economists state that these two variables are positively related.
 -For a given value of x,which will be wider,a 90% confidence interval or a 90% prediction interval? Explain.
(Essay)
4.9/5 (37)
THE NEXT QUESTIONS ARE BASED ON THE FOLLOWING INFORMATION:
A college administers for all its courses a student evaluation questionnaire.For a random sample 12 courses the accompanying table shows both the average student ratings of the instructor (on a scale from 1 to 5),and the average expected grades of the students (on a scale from 0 to 4).
 -What does the least-squares criterion have to do with obtaining a regression line for a given set of data?
(Essay)
4.8/5 (34)
In a simple regression problem,the following data is shown below: Standard error of estimate se = 18,n = 10.
What is the error sum of squares?
(Multiple Choice)
4.9/5 (48)
The hypothesis test for the population slope relies on the F distribution.
(True/False)
4.9/5 (27)
THE NEXT QUESTIONS ARE BASED ON THE FOLLOWING INFORMATION:
The data below are for the number of unemployed persons (in millions)and the federal unemployment insurance payments (in billions of dollars)for the years 1978-1985.Some economists state that these two variables are positively related.
-Differentiate between a confidence interval and a prediction interval.
(Essay)
4.8/5 (32)
THE NEXT QUESTIONS ARE BASED ON THE FOLLOWING INFORMATION:
A professor of statistics is interested in studying the relationship between the number of hours graduate students spent studying for his comprehensive final exam and the exam score.The results of the regression analysis of hours studied on exam scores are presented below. 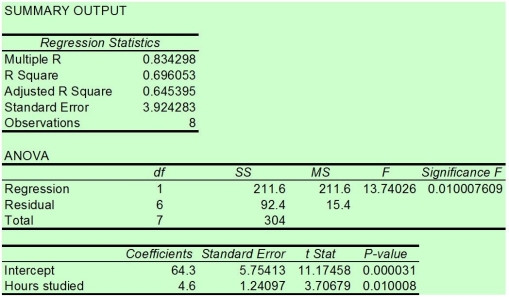 -In a regression problem the following pairs of (x,y)are given: (-2,4),(-1,1),(0,0),(1,1)and (2,4).What is the value of the coefficient of determination?
(Multiple Choice)
4.8/5 (34)
What is the difference between a population linear regression model and an estimated linear regression model?
(Essay)
4.8/5 (32)
THE NEXT QUESTIONS ARE BASED ON THE FOLLOWING INFORMATION:
A sales manager is interested in determining the relationship between the amount spent on advertising and total sales.The manager collects data for the past 24 months and runs a regression of sales on advertising expenditures.The results are presented below but,unfortunately,some values identified by asterisks are missing.
SUMMARY OUTPUT 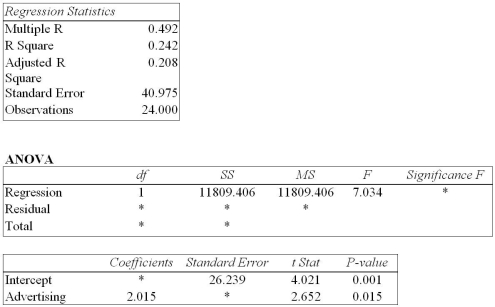 -The value of mean square error is:
(Multiple Choice)
4.7/5 (38)
THE NEXT QUESTIONS ARE BASED ON THE FOLLOWING INFORMATION:
A professor of statistics is interested in studying the relationship between the number of hours graduate students spent studying for his comprehensive final exam and the exam score.The results of the regression analysis of hours studied on exam scores are presented below.
-If the coefficient of correlation is 0.75,what is the value of the coefficient of determination?
(Multiple Choice)
4.7/5 (42)
Suppose that for two random variables,x and y,we test H0 : ρ = 0 against a two-sided alternative,and we are unable to reject the null hypothesis.We could therefore conclude that there is no relationship between x and y.
(True/False)
4.8/5 (35)
THE NEXT QUESTIONS ARE BASED ON THE FOLLOWING INFORMATION:
A college administers for all its courses a student evaluation questionnaire.For a random sample 12 courses the accompanying table shows both the average student ratings of the instructor (on a scale from 1 to 5),and the average expected grades of the students (on a scale from 0 to 4).
-Calculate the covariance between instructor ratings and expected grades.
(Essay)
4.8/5 (28)
THE NEXT QUESTIONS ARE BASED ON THE FOLLOWING INFORMATION:
A sales manager is interested in determining the relationship between the amount spent on advertising and total sales.The manager collects data for the past 24 months and runs a regression of sales on advertising expenditures.The results are presented below but,unfortunately,some values identified by asterisks are missing.
SUMMARY OUTPUT
-Determine the value of residual sum of squares.
(Multiple Choice)
4.9/5 (29)
THE NEXT QUESTIONS ARE BASED ON THE FOLLOWING INFORMATION:
Suppose we have the following information from a simple regression:
b0= 117.4,b1 = -14.39,s  = 0.18,s
  = 0.18,n = 300,
  = 4.3,SST = 17,045,and SSE = 12,053.
-The correlation coefficient is:
= 4.3,SST = 17,045,and SSE = 12,053.
-The correlation coefficient is:
(Multiple Choice)
4.8/5 (38)
THE NEXT QUESTIONS ARE BASED ON THE FOLLOWING INFORMATION:
A professor of statistics is interested in studying the relationship between the number of hours graduate students spent studying for his comprehensive final exam and the exam score.The results of the regression analysis of hours studied on exam scores are presented below.
-Determine the slope of the sample regression line.
(Multiple Choice)
5.0/5 (38)
Test H0 : β = 1 vs.H1 : β < 1 if the following regression information are given: b1 = 1.39,s  = 0.18,and n = 30.
(Multiple Choice)
4.7/5 (40)
THE NEXT QUESTIONS ARE BASED ON THE FOLLOWING INFORMATION:
Consider the following values of variables x and y:
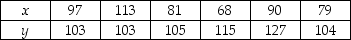 -Determine the coefficient of determination.What does it mean?
(Essay)
4.7/5 (37)
Filters
- Essay(0)
- Multiple Choice(0)
- Short Answer(0)
- True False(0)
- Matching(0)