Exam 11: The Origin and Evolution of Early Life
Exam 1: An Overview of Evolutionary Biology40 Questions
Exam 2: Early Evolutionary Ideas and Darwins Insight43 Questions
Exam 3: Natural Selection45 Questions
Exam 4: Phylogeny and Evolutionary History43 Questions
Exam 5: Inferring Phylogeny47 Questions
Exam 6: Transmission Genetics and the Sources of Genetic Variation43 Questions
Exam 7: The Genetics of Populations42 Questions
Exam 8: Evolution in Finite Populations38 Questions
Exam 9: Evolution at Multiple Loci39 Questions
Exam 10: Genome Evolution38 Questions
Exam 11: The Origin and Evolution of Early Life42 Questions
Exam 12: Major Transitions42 Questions
Exam 13: Evolution and Development39 Questions
Exam 14: Species and Speciation37 Questions
Exam 15: Extinction and Evolutionary Trends25 Questions
Exam 16: The Evolution of Sex32 Questions
Exam 17: Sexual Selection23 Questions
Exam 18: The Evolution of Sociality31 Questions
Exam 19: Coevolution26 Questions
Exam 20: Evolution and Medicine27 Questions
Select questions type
The graph below plots average ocean temperature,with two different estimates,using different methods.What has been the trend over time? 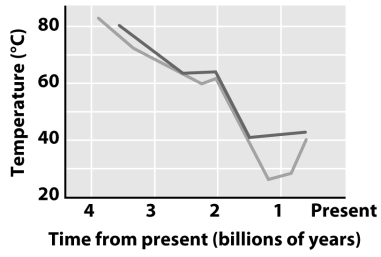
(Multiple Choice)
4.7/5  (39)
(39)
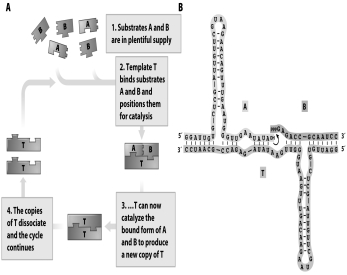 The schematic diagram above of a simple self-replicating system demonstrates that
(Multiple Choice)
4.8/5 (37)
Filters
- Essay(0)
- Multiple Choice(0)
- Short Answer(0)
- True False(0)
- Matching(0)