Exam 15: Extinction and Evolutionary Trends
Exam 1: An Overview of Evolutionary Biology40 Questions
Exam 2: Early Evolutionary Ideas and Darwins Insight43 Questions
Exam 3: Natural Selection45 Questions
Exam 4: Phylogeny and Evolutionary History43 Questions
Exam 5: Inferring Phylogeny47 Questions
Exam 6: Transmission Genetics and the Sources of Genetic Variation43 Questions
Exam 7: The Genetics of Populations42 Questions
Exam 8: Evolution in Finite Populations38 Questions
Exam 9: Evolution at Multiple Loci39 Questions
Exam 10: Genome Evolution38 Questions
Exam 11: The Origin and Evolution of Early Life42 Questions
Exam 12: Major Transitions42 Questions
Exam 13: Evolution and Development39 Questions
Exam 14: Species and Speciation37 Questions
Exam 15: Extinction and Evolutionary Trends25 Questions
Exam 16: The Evolution of Sex32 Questions
Exam 17: Sexual Selection23 Questions
Exam 18: The Evolution of Sociality31 Questions
Exam 19: Coevolution26 Questions
Exam 20: Evolution and Medicine27 Questions
Select questions type
The figure below shows the increasing morphological complexity in crustacean legs in 12 different phylogenetic comparisons.Why did the authors of this study choose to analyze the data independently for each comparison? 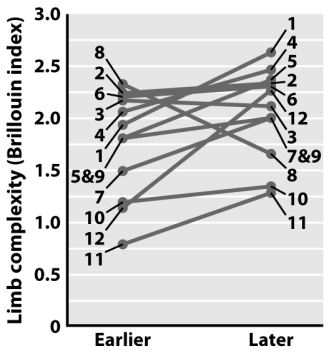
Free
(Multiple Choice)
4.8/5  (29)
(29)
Correct Answer: Verified
D
Why are endemic species particularly endangered by global climate change?
Free
(Multiple Choice)
4.9/5 (35)
Correct Answer:Verified
D
The probability of extinction via predation is particularly high when
Free
(Multiple Choice)
4.8/5 (30)
Correct Answer:Verified
E
What kinds of evolutionary trends are represented by each of the two diagrams below? The x-axis represents an arbitrary scale for a trait value,in this case eyespot diameter on a butterfly's wing. 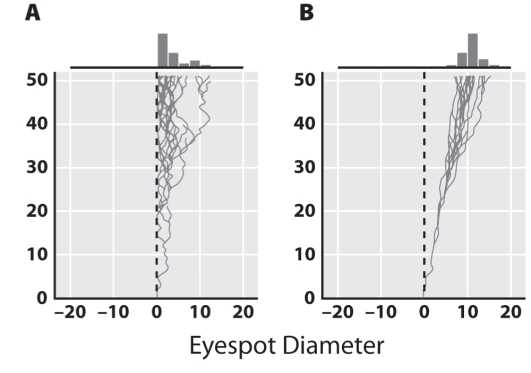
(Multiple Choice)
4.8/5 (37)
Which of the following scenarios may produce an active trend in evolutionary change? Briefly justify your answer.
A.The mechanic stability of the exoskeleton of a group of terrestrial arthropods imposes an upper limit on the body size of these organisms.B.The evolution of an endoparasitic lifestyle results in overall smaller body size as parasite species diversify to utilize small-bodied hosts,which are more common than large bodied hosts.
(Essay)
4.9/5 (34)
While studying a group of ammonites (an extinct lineage of cephalopods)that lived during the Mesozoic,you measure the shell diameter of different fossil ammonite species.The table below represents the data you collected for each of six different time periods.What rule does the data conform to? 
(Multiple Choice)
4.8/5 (36)
Describe how mean and variance of a trait value change in the absence of an evolutionary trend as a lineage diversifies.Use +,-,or = to indicate an increase,a decrease,or no change,respectively.You can use one,two,or all of the symbols to describe the possible changes in both mean and variance.Mean:
Variance:
(Short Answer)
4.8/5 (35)
Which of the following observations would be expected if an infectious disease were a contributor to amphibian decline?
(Multiple Choice)
4.8/5 (27)
Where would you place the actual extinction date of a taxon if you knew that the Signor-Lipps effect was at work?
(Multiple Choice)
4.9/5 (26)
What effect of mass extinctions is described by the expression "dead clade walking"?
(Essay)
4.8/5 (31)
The earliest Homo sapiens fossils are about 200,000 years old.Could you use radiocarbon dating to determine the age of fossils from that period? Briefly justify your answer.
(Essay)
4.9/5 (37)
The graph below shows extinction rates during different periods of Earth's history.How many mass extinction events do scientists commonly infer from these data? 
(Multiple Choice)
4.8/5 (43)
Which of the following is the greatest known mass extinction to date?
(Multiple Choice)
4.8/5 (43)
Data on extinction rates pre- and post-mass extinction rates suggest that the extinction rate remains elevated for some time after the mass extinction event.Which of the following statements is a plausible explanation for this observation?
(Multiple Choice)
4.7/5 (35)
The graph below shows the extinction rates for families of marine organisms over different periods of Earth's history.What is the best estimate for the background extinction rate given these data? 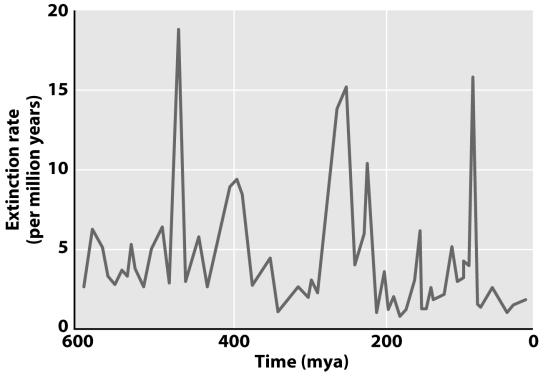
(Multiple Choice)
4.8/5 (38)
Approximately what percentage of marine species was lost during the Permian extinction?
(Multiple Choice)
4.8/5 (33)
Native plant A is endangered.You suspect that part of the reason for its decline is competition with an introduced exotic plant,B,that occupies a similar ecological niche.Which of the following experiments would help you decide whether competition with B contributes to the decline of A?
(Multiple Choice)
4.7/5 (40)
Elevated levels of iridium are found in the geologic layer at the K-T boundary.Is this unusual?
(Multiple Choice)
4.8/5 (38)
Filters
- Essay(0)
- Multiple Choice(0)
- Short Answer(0)
- True False(0)
- Matching(0)