Exam 3: Describing Data Using Numerical Measures
Exam 1: The Where,Why,and How of Data Collection167 Questions
Exam 2: Graphs,Charts and Tablesdescribing Your Data139 Questions
Exam 3: Describing Data Using Numerical Measures138 Questions
Exam 4: Introduction to Probability125 Questions
Exam 5: Discrete Probability Distributions161 Questions
Exam 6: Introduction to Continuous Probability Distributions122 Questions
Exam 7: Introduction to Sampling Distributions136 Questions
Exam 8: Estimating Single Population Parameters174 Questions
Exam 9: Introduction to Hypothesis Testing183 Questions
Exam 10: Estimation and Hypothesis Testing for Two Population Parameters121 Questions
Exam 11: Hypothesis Tests and Estimation for Population Variances69 Questions
Exam 12: Analysis of Variance162 Questions
Exam 13: Goodness-Of-Fit Tests and Contingency Analysis105 Questions
Exam 14: Introduction to Linear Regression and Correlation Analysis139 Questions
Exam 15: Multiple Regression Analysis and Model Building152 Questions
Exam 16: Analyzing and Forecasting Time-Series Data133 Questions
Exam 17: Introduction to Nonparametric Statistics103 Questions
Exam 18: Introduction to Quality and Statistical Process Control43 Questions
Select questions type
In the annual report,a major food chain stated that the distribution of daily sales at its Detroit stores is known to be bell-shaped,and that 95 percent of all daily sales fell between $19,200 and $36,400.Based on this information,what were the mean sales?
(Multiple Choice)
4.8/5  (38)
(38)
One of the reasons that the standard deviation is preferred as a measure of variation over the variance is that the standard deviation is measured in the original units.
(True/False)
4.9/5 (35)
Data are considered to be right-skewed when the mean lies to the right of the median.
(True/False)
4.8/5 (28)
A recent study in the restaurant business determined that the mean tips for male waiters per hour of work are $6.78 with a standard deviation of $2.11.The mean tips per hour for female waiters are $7.86 with a standard deviation of $2.20.Based on this information,which of the following statements do we know to be true?
(Multiple Choice)
5.0/5 (33)
The following data reflect the number of customers who return merchandise for a refund on Monday.Note these data reflect the population of all 10 Mondays for which data are available. 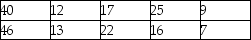 Based on these data,what is the standard deviation?
(Multiple Choice)
4.9/5 (30)
The interquartile range is the difference between the mean and the median.
(True/False)
4.8/5 (36)
A data set in which the mean,median,and mode are all equal is said to be a skewed distribution.
(True/False)
4.8/5 (28)
Acme Taxi has two taxi cabs.The manager tracks the daily revenue for each cab.Over the past 20 days,Cab A has averaged $76.00 per night with a standard deviation equal to $11.00.Cab B has averaged $200.00 per night with a standard deviation of $18.00.Based on this information,the coefficient of variation for Cab B is 9 percent.
(True/False)
4.9/5 (36)
The Empirical Rule states that for a bell-shaped distribution,approximately 95 percent of data should lie within:
(Multiple Choice)
4.8/5 (32)
A professor wishes to develop a numerical method for giving grades.He intends to base the grade on homework,two midterms,a project,and a final examination.He wishes the final exam to have the largest influence on the grade.He wants the project to have 10%,each midterm to have 20%,and the homework to have 10% of the influence of the semester grade. For a student with the following grades during the quarter,calculate a weighted average for the course:

(Multiple Choice)
4.8/5 (41)
The asking price for homes on the real estate market in Baltimore has a mean value of $286,455 and a standard deviation of $11,200.Four homes are listed by one real estate company with the following prices: 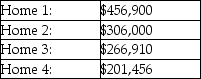 Based upon this information,which house has a standardized value that is relatively closest to zero?
(Multiple Choice)
4.9/5 (37)
At a sawmill in Oregon,a process improvement team measured the diameters for a sample of 1,500 logs.The following summary statistics were computed:  Given this information,in a box and whisker plot,which of these four values will NOT appear?
(Multiple Choice)
4.9/5 (30)
Consider the following sample data:  For these data the sample mean is:
(Multiple Choice)
4.9/5 (30)
If the age distribution of customers at a major retail chain is thought to be bell-shaped with a mean equal to 43 years and a standard deviation equal to 7 years,the percentage of customers between the ages of 29 and 57 years is:
(Multiple Choice)
4.8/5 (32)
Why is it that when we find the sample standard deviation,we divide by n-1 but when we find the population standard deviation we divide by n?
(Essay)
4.8/5 (37)
Explain how the empirical rule can be used to help describe data in a population or a sample.
(Essay)
4.8/5 (46)
Filters
- Essay(0)
- Multiple Choice(0)
- Short Answer(0)
- True False(0)
- Matching(0)