Exam 3: Describing Data Using Numerical Measures
Exam 1: The Where,Why,and How of Data Collection167 Questions
Exam 2: Graphs,Charts and Tablesdescribing Your Data139 Questions
Exam 3: Describing Data Using Numerical Measures138 Questions
Exam 4: Introduction to Probability125 Questions
Exam 5: Discrete Probability Distributions161 Questions
Exam 6: Introduction to Continuous Probability Distributions122 Questions
Exam 7: Introduction to Sampling Distributions136 Questions
Exam 8: Estimating Single Population Parameters174 Questions
Exam 9: Introduction to Hypothesis Testing183 Questions
Exam 10: Estimation and Hypothesis Testing for Two Population Parameters121 Questions
Exam 11: Hypothesis Tests and Estimation for Population Variances69 Questions
Exam 12: Analysis of Variance162 Questions
Exam 13: Goodness-Of-Fit Tests and Contingency Analysis105 Questions
Exam 14: Introduction to Linear Regression and Correlation Analysis139 Questions
Exam 15: Multiple Regression Analysis and Model Building152 Questions
Exam 16: Analyzing and Forecasting Time-Series Data133 Questions
Exam 17: Introduction to Nonparametric Statistics103 Questions
Exam 18: Introduction to Quality and Statistical Process Control43 Questions
Select questions type
A store manager tracks the number of customer complaints each week.The following data reflect a random sample of ten weeks.
 The variance for these data is approximately 27.78.
(True/False)
4.9/5  (32)
(32)
In a recent study of the sales prices of houses in a Midwestern city,the mean sales price has been reported to be $167,811 while the median sales price was $155,600.From this information,you can determine that the data involved in the study are left-skewed.
(True/False)
4.7/5 (33)
The AMI Company has two assembly lines in its Kansas City plant.Line A produces an average of 335 units per day with a standard deviation equal to 11 units.Line B produces an average of 145 units per day with a standard deviation equal to 8 units.Based on this information,which line is relatively more consistent?
(Essay)
4.9/5 (30)
When a variance is calculated for a data set,the resulting value is the same regardless of whether the data set is treated as a population or a sample.
(True/False)
4.9/5 (35)
Suppose a study of houses that have sold recently in your community showed the following frequency distribution for the number of bedrooms:
 Based on this information,it is possible to determine that the distribution of bedrooms in homes sold is right-skewed.
(True/False)
4.8/5 (39)
In drawing a box and whisker plot the upper limit length of the whiskers is 1.5(Q3-Q1).
(True/False)
4.9/5 (34)
A recent study involving a sample of 3,000 vehicles in California showed the following statistics related to the number of miles driven per day: Q1 = 12,Q2 = 45,and Q3 = 56.Based on these data,if a box and whisker plot is developed,the upper limit value is 122 miles.
(True/False)
4.7/5 (29)
Dynamic random-access memory (DRAM)memory chips are made from silicon wafers in manufacturing facilities through a very complex process called wafer fabs.The wafers are routed through the fab machines in an order that is referred to as a recipe.The wafers may go through the same machine several times as the chip is created.The data file DRAM Chips contains a sample of processing times,measured in fractions of hours,at a particular machine center for one chip recipe. Determine what the mode processing time is.
(Multiple Choice)
4.8/5 (32)
What is meant by the concept,standardizing the data? Explain why a decision maker may wish to compute a standardized value.
(Essay)
4.9/5 (31)
The credit card balances for customers at State Bank and Trust has a mean equal to $800 and a standard deviation equal to $60.00.Kevin Smith's balance is $1,352.Based on this,his standardized value is 9.20.
(True/False)
4.8/5 (36)
Suppose that the distribution of grocery purchases is thought to be symmetric.If the mean purchase is $23.14,what would the median purchase be?
(Essay)
5.0/5 (41)
If after graphing the data for a quantitative variable of interest,you notice that the distribution is highly skewed in the positive direction,the measure of central location that would likely provide the best assessment of the center would be the median.
(True/False)
4.8/5 (30)
When news articles report on household income level they usually report the median income,rather than the mean income.This would be because income is usually a right-skewed distribution.
(True/False)
4.7/5 (35)
A recent study involving a sample of 3,000 vehicles in California showed the following statistics related to the number of miles driven per day: Q1 = 12,Q2 = 45,and Q3 = 56.Based on these data,we know that the distribution is skewed.
(True/False)
4.9/5 (32)
A dairy farm in Wisconsin bottles milk in one gallon containers.At a recent meeting,the production manager asked top management for a new filling machine that he argued would assure that all containers had exactly one gallon of milk.Based on sound statistical principles,the top management group should conclude that the production manager could have merit to his argument.
(True/False)
4.8/5 (28)
Suppose a study of houses that have sold recently in your community showed the following frequency distribution for the number of bedrooms:
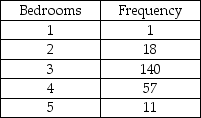 Based on this information,the mode for the data is 140.
(True/False)
4.8/5 (27)
For a given set of data,if the data are treated as a population,the calculated standard deviation will be less than it would be had the data been treated as a sample.
(True/False)
4.8/5 (38)
The number of days that homes stay on the market before they sell in Houston is bell-shaped with a mean equal to 56 days.Further,95 percent of all homes are on the market between 40 and 72 days.Based on this information,what is the standard deviation for the number of days that houses stay on the market in Houston?
(Multiple Choice)
4.8/5 (40)
Todd Lindsey & Associates,a commercial real estate company located in Boston,owns six office buildings in the Boston area that it leases to businesses.The lease price per square foot differs by building due to location and building amenities.Currently,all six buildings are fully leased at the prices shown here. 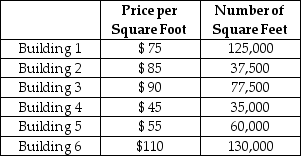 Compute the weighted average (mean)price per square foot for these buildings.
(Multiple Choice)
4.8/5 (34)
Which of the following is the most frequently used measure of variation?
(Multiple Choice)
4.7/5 (22)
Filters
- Essay(0)
- Multiple Choice(0)
- Short Answer(0)
- True False(0)
- Matching(0)