Exam 3: Describing Data Using Numerical Measures
Exam 1: The Where,Why,and How of Data Collection167 Questions
Exam 2: Graphs,Charts and Tablesdescribing Your Data139 Questions
Exam 3: Describing Data Using Numerical Measures138 Questions
Exam 4: Introduction to Probability125 Questions
Exam 5: Discrete Probability Distributions161 Questions
Exam 6: Introduction to Continuous Probability Distributions122 Questions
Exam 7: Introduction to Sampling Distributions136 Questions
Exam 8: Estimating Single Population Parameters174 Questions
Exam 9: Introduction to Hypothesis Testing183 Questions
Exam 10: Estimation and Hypothesis Testing for Two Population Parameters121 Questions
Exam 11: Hypothesis Tests and Estimation for Population Variances69 Questions
Exam 12: Analysis of Variance162 Questions
Exam 13: Goodness-Of-Fit Tests and Contingency Analysis105 Questions
Exam 14: Introduction to Linear Regression and Correlation Analysis139 Questions
Exam 15: Multiple Regression Analysis and Model Building152 Questions
Exam 16: Analyzing and Forecasting Time-Series Data133 Questions
Exam 17: Introduction to Nonparametric Statistics103 Questions
Exam 18: Introduction to Quality and Statistical Process Control43 Questions
Select questions type
Dynamic random-access memory (DRAM)memory chips are made from silicon wafers in manufacturing facilities through a very complex process called wafer fabs.The wafers are routed through the fab machines in an order that is referred to as a recipe.The wafers may go through the same machine several times as the chip is created.The data file DRAM Chips contains a sample of processing times,measured in fractions of hours,at a particular machine center for one chip recipe. Compute the mean processing time.
(Multiple Choice)
4.9/5  (30)
(30)
Consider a situation involving two populations where population 1 is known to have a higher coefficient of variation than population 2.In this situation,we know that population 1 has a higher standard deviation than population 2.
(True/False)
5.0/5 (28)
First Pacific Bank has determined that the mean checking account balance for all its customers is currently $743.50.Based on this,it is fair to say that about half the customers have balances exceeding $743.50.
(True/False)
4.9/5 (38)
The following sample data reflect electricity bills for ten households in San Diego in March.
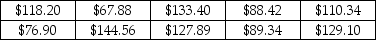 Compute the range,variance,and standard deviation for these sample data.Discuss which of these three measures you would prefer to use as a measure of variation.
(Essay)
4.8/5 (42)
The Good-Guys Car Dealership has tracked the number of used cars sold at its downtown dealership.Consider the following data as representing the population of cars sold in each of the 8 weeks that the dealership has been open.
 The population standard deviation is approximately 2.87 cars.
(True/False)
4.9/5 (24)
If a distribution for a quantitative variable is thought to be nearly symmetric with very little variation,and a box and whisker plot is created for this distribution,which of the following is true?
(Multiple Choice)
5.0/5 (30)
Acme Taxi has two taxi cabs.The manager tracks the daily revenue for each cab.Over the past 20 days,Cab A has averaged $76.00 per night with a standard deviation equal to $11.00.Cab B has averaged $200.00 per night with a standard deviation of $18.00.Based on this information,Cab B has the greatest relative variation.
(True/False)
4.8/5 (27)
When the median of a data set is 110 and the mean is 127,the percentile associated with the mean must be higher than 50 percent.
(True/False)
4.8/5 (38)
The right and left edges of the box in a box and whisker plot represent the 3rd and 1st quartiles,respectively.
(True/False)
4.8/5 (38)
A store manager tracks the number of customer complaints each week.The following data reflect a random sample of ten weeks.
 The standard deviation for these data is approximately 27.78.
(True/False)
4.8/5 (34)
Consider the following data,which represent the number of miles that employees commute from home to work each day.There are two samples: one for males and one for females. Males:
 Females:
 The coefficient of variation of commute miles for the males is:
(Multiple Choice)
4.8/5 (39)
Portfolio A of a collection of stocks is considered more risky than portfolio B if:
(Multiple Choice)
4.8/5 (36)
The following data reflect the number of customers who test drove new cars each day for a sample of 20 days at the Redfield Ford Dealership. 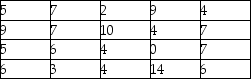 Given these data,what is the range?
(Multiple Choice)
4.7/5 (43)
Suppose a study of houses that have sold recently in your community showed the following frequency distribution for the number of bedrooms:
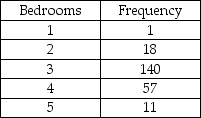 Based on this information,the median number of bedrooms in houses sold is 3.20.
(True/False)
4.8/5 (42)
A major retail store has studied customer behavior and found that the distribution of time customers spend in a store per visit is symmetric with a mean equal to 17.3 minutes.Based on this information,which of the following is true?
(Multiple Choice)
4.8/5 (33)
A large retail company gives an employment screening test to all prospective employees.Franklin Gilman recently took the test and it was reported back to him that his score placed him at the 80th percentile.Therefore:
(Multiple Choice)
4.8/5 (35)
Based on the empirical rule we can expect about 95 percent of the values in bell-shaped distributions to be within ± one standard deviation of the mean.
(True/False)
4.8/5 (42)
The distribution of bankcard balances for customers is highly right-skewed with a mean of $1,100 and a standard deviation equal to $250.Based on this information,approximately 68 percent of the customers will have bank balances between $850 and $1,350.
(True/False)
4.7/5 (32)
It is possible for a set of data to have multiple modes as well as multiple medians,but there can be only one mean.
(True/False)
4.9/5 (38)
Filters
- Essay(0)
- Multiple Choice(0)
- Short Answer(0)
- True False(0)
- Matching(0)