Exam 3: Describing Data Using Numerical Measures
Exam 1: The Where,Why,and How of Data Collection167 Questions
Exam 2: Graphs,Charts and Tablesdescribing Your Data139 Questions
Exam 3: Describing Data Using Numerical Measures138 Questions
Exam 4: Introduction to Probability125 Questions
Exam 5: Discrete Probability Distributions161 Questions
Exam 6: Introduction to Continuous Probability Distributions122 Questions
Exam 7: Introduction to Sampling Distributions136 Questions
Exam 8: Estimating Single Population Parameters174 Questions
Exam 9: Introduction to Hypothesis Testing183 Questions
Exam 10: Estimation and Hypothesis Testing for Two Population Parameters121 Questions
Exam 11: Hypothesis Tests and Estimation for Population Variances69 Questions
Exam 12: Analysis of Variance162 Questions
Exam 13: Goodness-Of-Fit Tests and Contingency Analysis105 Questions
Exam 14: Introduction to Linear Regression and Correlation Analysis139 Questions
Exam 15: Multiple Regression Analysis and Model Building152 Questions
Exam 16: Analyzing and Forecasting Time-Series Data133 Questions
Exam 17: Introduction to Nonparametric Statistics103 Questions
Exam 18: Introduction to Quality and Statistical Process Control43 Questions
Select questions type
Under what circumstances is it necessary to use the coefficient of variation to compare relative variability between two or more distributions?
(Multiple Choice)
4.9/5  (30)
(30)
When surveyed,a sample of 1,250 patients at a regional hospital provided interviewers with the following summary statistics pertaining to the hospital charges:
Minimum = $278.00 Q1 = $1,245 Q2 = $3,567 Q3= $4,702.
Based on these data,the distribution is seen to be symmetric.
(True/False)
4.8/5 (37)
You are given the following data:
 Assuming that the data reflect a sample from a larger population,the sample mean is 30.00.
(True/False)
4.8/5 (32)
The asking price for homes on the real estate market in Baltimore has a mean value of $286,455 and a standard deviation of $11,200.The mean and standard deviation in asking price for homes in Denver are $188,468 and $8,230,respectively.Recently,one home sold in each city where the asking price for each home was $193,000.Assuming that both distributions are bell-shaped,which of the following statements is true?
(Multiple Choice)
4.8/5 (37)
The following sample data reflect electricity bills for ten households in San Diego in March.
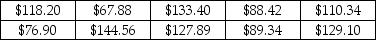 Determine three measures of central tendency for these sample data.Then,based on these measures,determine whether the sample data are symmetric or skewed.
(Essay)
4.8/5 (27)
The owner of a local gasoline station has kept track of the number of gallons of regular unleaded sold at his station every day since he purchased the station.This morning,he computed the mean number of gallons.This value would be considered a statistic.
(True/False)
4.7/5 (40)
A set of data is considered to be symmetric if the 3rd quartile is three times larger than the 1st quartile.
(True/False)
4.7/5 (45)
You are given the following data:
 Assuming that these data are a sample selected from a larger population,the median value for these sample data is 25.5.
(True/False)
4.8/5 (41)
A recent study involving a sample of 3,000 vehicles in California showed the following statistics related to the number of miles driven per day: Q1 = 12,Q2 = 45,and Q3 = 56.Based on these data,if a box and whisker plot is developed,a value of 110 is an outlier.
(True/False)
4.8/5 (37)
Explain how Tchebysheff's theorem can be used to help describe data in a population or a sample.
(Essay)
4.8/5 (37)
The sample mean is an estimate of μ and may be either higher or lower than μ depending on the sample.
(True/False)
4.9/5 (33)
If a set of data has 540 values,the 3rd quartile corresponds to approximately the 135th value when the data have been arranged in numerical order.
(True/False)
4.7/5 (38)
You are given the following data:
 Assuming that these data reflect the population of interest,these data can be considered symmetric.
(True/False)
4.8/5 (27)
A small company has 7 employees.The numbers of years these employees have worked for this company are shown as follows:  Based upon this information,the median number of years that employees have been with this company is:
(Multiple Choice)
4.9/5 (44)
Suppose the standard deviation for a given sample is known to be 20.If the data in the sample are doubled,the standard deviation will be 40.
(True/False)
4.9/5 (30)
Consider the following data,which represent the number of miles that employees commute from home to work each day.There are two samples: one for males and one for females. Males:
 Females:
 Which of the following statements is true?
(Multiple Choice)
5.0/5 (38)
For ordinal data,________ is the preferred measure of central location.
(Multiple Choice)
4.8/5 (37)
You are given the following data:
 Assuming that the data reflect the population of interest,the mean of the population is 36.00.
(True/False)
4.8/5 (33)
At a sawmill in Oregon,a process improvement team measured the diameters for a sample of 1,500 logs.The following summary statistics were computed:  Given this information,for a box and whisker plot which of the following statements is appropriate?
(Multiple Choice)
4.7/5 (33)
The advantage of using the interquartile range as a measure of variation is that it utilizes all the data in its computation.
(True/False)
4.7/5 (28)
Filters
- Essay(0)
- Multiple Choice(0)
- Short Answer(0)
- True False(0)
- Matching(0)