Exam 10: Estimation and Hypothesis Testing for Two Population Parameters
Exam 1: The Where,Why,and How of Data Collection167 Questions
Exam 2: Graphs,Charts and Tablesdescribing Your Data139 Questions
Exam 3: Describing Data Using Numerical Measures138 Questions
Exam 4: Introduction to Probability125 Questions
Exam 5: Discrete Probability Distributions161 Questions
Exam 6: Introduction to Continuous Probability Distributions122 Questions
Exam 7: Introduction to Sampling Distributions136 Questions
Exam 8: Estimating Single Population Parameters174 Questions
Exam 9: Introduction to Hypothesis Testing183 Questions
Exam 10: Estimation and Hypothesis Testing for Two Population Parameters121 Questions
Exam 11: Hypothesis Tests and Estimation for Population Variances69 Questions
Exam 12: Analysis of Variance162 Questions
Exam 13: Goodness-Of-Fit Tests and Contingency Analysis105 Questions
Exam 14: Introduction to Linear Regression and Correlation Analysis139 Questions
Exam 15: Multiple Regression Analysis and Model Building152 Questions
Exam 16: Analyzing and Forecasting Time-Series Data133 Questions
Exam 17: Introduction to Nonparametric Statistics103 Questions
Exam 18: Introduction to Quality and Statistical Process Control43 Questions
Select questions type
Most companies that make golf balls and golf clubs use a one-armed robot named "Iron Byron" to test their balls for length and accuracy,but because of swing variations by real golfers,these test robots don't always indicate how the clubs will perform in actual use.One company in the golfing industry is interested in testing its new driver to see how it compares with the best-selling driver.To do this,it has selected a group of golfers of differing abilities and ages.Its plan is to have each player use each of the two clubs and hit five balls.It will record the average length of the drives with each club for each player.Given this description of the planned test,which of the following statements is true?
(Multiple Choice)
4.8/5  (35)
(35)
An advertising company has developed a new ad for one of the national car manufacturing companies.The ad agency is interested in testing whether the proportion of favorable response to the ad is the same between male adults versus female adults.It plans on conducting the test using an alpha level equal to 0.05.A sample of 100 adults of each gender will be used in the study.Each person will be asked to view the ad and indicate whether they find the ad to be "pleasing" or not.The samples resulted in 57 males that liked the ad and 47 females that liked the ad.Based on this information,what is the value of the test statistic?
(Multiple Choice)
4.8/5 (39)
Suppose a survey is taken of two groups of people where each person is asked a yes/no question and the proportion of people who answer yes is calculated for each group.Which of the following is true about a hypothesis test of the difference in the two proportions?
(Multiple Choice)
4.7/5 (40)
The following paired samples have been obtained from normally distributed populations.Construct a 90% confidence interval estimate for the mean paired difference between the two population means. 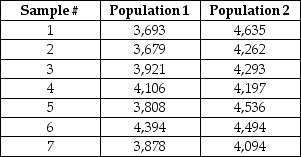
(Multiple Choice)
4.9/5 (35)
An accounting firm has been hired by a large computer company to determine whether the proportion of accounts receivables with errors in one division (Division 1)exceeds that of the second division (Division 2).The managers believe that such a difference may exist because of the lax standards employed by the first division.To conduct the test,the accounting firm has selected random samples of accounts from each division with the following results.
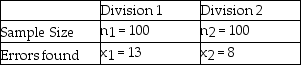 Based on this information,and using a significance level equal to 0.05,the pooled estimator for the overall proportion is
  = .1050.
(True/False)
4.7/5 (43)
A pet food producer manufactures and then fills 25-pound bags of dog food on two different production lines located in separate cities.In an effort to determine whether differences exist between the average fill rates for the two lines,a random sample of 19 bags from line 1 and a random sample of 23 bags from line 2 were recently selected.Each bag's weight was measured and the following summary measures from the samples are reported: 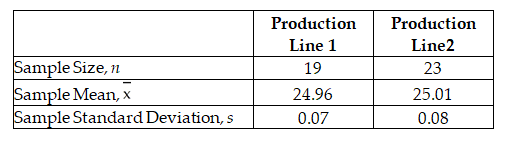 Management believes that the fill rates of the two lines are normally distributed with equal variances.
Develop a 95% confidence interval estimate of the true mean difference between the two lines.
Management believes that the fill rates of the two lines are normally distributed with equal variances.
Develop a 95% confidence interval estimate of the true mean difference between the two lines.
(Multiple Choice)
4.8/5 (33)
In order to make the test for the difference between two population means valid,the sample size in each independent sample must be the same.
(True/False)
4.7/5 (42)
In testing for differences between the means of two paired populations,an appropriate null hypothesis would be:
(Multiple Choice)
4.9/5 (41)
Two samples are said to be independent if they are collected at different points in time.
(True/False)
4.8/5 (40)
Recently the managers for a large retail department store stated that a study has revealed that female shoppers spend on average 23.5 minutes longer in the store per visit than do male shoppers.Based on this information,the managers can be confident that female shoppers,as a population,do spend longer times in the store than do males shoppers,as a population.
(True/False)
4.8/5 (35)
The American College Health Association produced the National College Health Assessment (Andy Gardiner,"Surfacing from Depression," February 6,2006).The assessment indicates that the percentage of U.S.college students who report having been diagnosed with depression has risen from 2000.The assessment surveyed 47,202 students at 74 campuses.It discovered that 10.3% and 14.9% of students indicated that they had been diagnosed with depression in 2000 and 2004,respectively.Assume that half of the students surveyed were surveyed in 2004. Conduct a hypothesis test to determine if there has been more than a 0.04 increase in the proportion of students who indicated they have been diagnosed with depression.Use a significance level of 0.05 and a p-value approach to this test.
(Multiple Choice)
4.7/5 (48)
Most companies that make golf balls and golf clubs use a one-armed robot named "Iron Byron" to test their balls for length and accuracy,but because of swing variations by real golfers,these test robots don't always indicate how the clubs will perform in actual use.One company in the golfing industry is interested in testing its new driver to see if it has greater length off the tee than the best-selling driver.To do this,it has selected a group of golfers of differing abilities and ages.Its plan is to have each player use each of the two clubs and hit five balls.It will record the average length of the drives with each club for each player.The resulting data for a sample of 10 players are:  What is an appropriate null hypothesis to be tested?
(Multiple Choice)
4.8/5 (41)
In an article entitled "Childhood Pastimes Are Increasingly Moving Indoors," Dennis Cauchon asserts that there have been huge declines in spontaneous outdoor activities such as bike riding,swimming,and touch football.In the article,he cites separate studies by the national Sporting Goods Association and American Sports Data that indicate bike riding alone is down 31% from 1995 to 2004.According to the surveys,68% of 7- to 11-year-olds rode a bike at least six times in 1995 and only 47% did in 2004.Assume the sample sizes were 1,500 and 2,000,respectively. Calculate a 95% confidence interval to estimate the proportion of 7- to 11-year-olds who rode their bike at least six times in 2004.
(Multiple Choice)
4.8/5 (35)
Most companies that make golf balls and golf clubs use a one-armed robot named "Iron Mike" to test their balls for length and accuracy,but because of swing variations by real golfers,these test robots don't always indicate how the clubs will perform in actual use.One company in the golfing industry is interested in testing its new driver to see if it has greater length off the tee than the best-selling driver.To do this,it has selected a group of golfers of differing abilities and ages.Its plan is to have each player use each of the two clubs and hit five balls.It will record the average length of the drives with each club for each player.The resulting data for a sample of 10 players are: 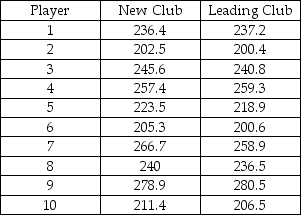 What is the critical value for the appropriate hypothesis test if the test is conducted using a 0.05 level of significance?
(Multiple Choice)
4.9/5 (37)
Box and whisker plots are often useful for determining whether two populations have distributions that might each be normally distributed.
(True/False)
4.8/5 (39)
Two placement exams are available that students can take to determine which math class they should begin with in their freshman year.It is believed that there is no difference in the mean scores that would be received for the two tests.To test this using a 0.05 level of significance,a randomly selected group of students took both tests and had their scores recorded.The following data were obtained:
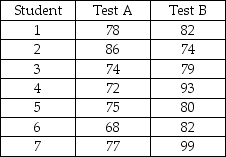 Based on these data,the test statistic is approximately t = -1.892.
(True/False)
4.9/5 (30)
To increase productivity,workers went through a training program.The management wanted to know the effectiveness of the program.A sample of seven workers was taken and their daily production rates before and after the training are shown below. 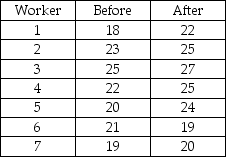 Based on the data,the training program is:
(Multiple Choice)
4.8/5 (42)
The following information is based on independent random samples taken from two normally distributed populations having equal variances: 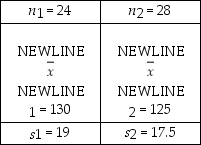 Based on the sample information,determine the 95% confidence interval estimate for the difference between the two population means.
(Multiple Choice)
4.8/5 (39)
A maker of toothpaste is interested in testing whether the proportion of adults (over age 18)who use its toothpaste and have no cavities within a six-month period is any different from the proportion of children (18 and under)who use the toothpaste and have no cavities within a six-month period.To test this,it has selected a sample of adults and a sample of children randomly from the population of those customers who use their toothpaste.The following results were observed.
Adults Children
Sample size 100 200
Number with 0 cavities 83 165
Based on these sample data and using a significance level of 0.05,what conclusion should be reached? Use the p-value approach to conduct the test.
(Essay)
4.9/5 (37)
There have been complaints recently from homeowners in the north end claiming that their homes have been assessed at values that are too high compare with other parts of town.They say that the mean increase from last year to this year has been higher in their part of town than elsewhere.To test this,the assessor's office staff plans to select a random sample of north end properties (group 1)and a random sample of properties from other areas within the city (group 2)and perform a hypothesis test.The following sample information is available: 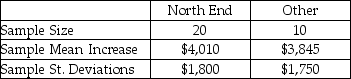 Assuming that the null hypothesis will be tested using an alpha level equal to 0.05,what is the value of the test statistic?
(Multiple Choice)
4.8/5 (38)
Filters
- Essay(0)
- Multiple Choice(0)
- Short Answer(0)
- True False(0)
- Matching(0)