Exam 10: Estimation and Hypothesis Testing for Two Population Parameters
Exam 1: The Where,Why,and How of Data Collection167 Questions
Exam 2: Graphs,Charts and Tablesdescribing Your Data139 Questions
Exam 3: Describing Data Using Numerical Measures138 Questions
Exam 4: Introduction to Probability125 Questions
Exam 5: Discrete Probability Distributions161 Questions
Exam 6: Introduction to Continuous Probability Distributions122 Questions
Exam 7: Introduction to Sampling Distributions136 Questions
Exam 8: Estimating Single Population Parameters174 Questions
Exam 9: Introduction to Hypothesis Testing183 Questions
Exam 10: Estimation and Hypothesis Testing for Two Population Parameters121 Questions
Exam 11: Hypothesis Tests and Estimation for Population Variances69 Questions
Exam 12: Analysis of Variance162 Questions
Exam 13: Goodness-Of-Fit Tests and Contingency Analysis105 Questions
Exam 14: Introduction to Linear Regression and Correlation Analysis139 Questions
Exam 15: Multiple Regression Analysis and Model Building152 Questions
Exam 16: Analyzing and Forecasting Time-Series Data133 Questions
Exam 17: Introduction to Nonparametric Statistics103 Questions
Exam 18: Introduction to Quality and Statistical Process Control43 Questions
Select questions type
A pet food producer manufactures and then fills 25-pound bags of dog food on two different production lines located in separate cities.In an effort to determine whether differences exist between the average fill rates for the two lines,a random sample of 19 bags from line 1 and a random sample of 23 bags from line 2 were recently selected.Each bag's weight was measured and the following summary measures from the samples are reported: 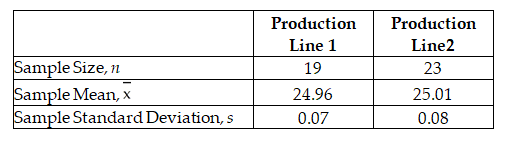 Management believes that the fill rates of the two lines are normally distributed with equal variances.
Calculate the point estimate for the difference between the population means of the two lines.
Management believes that the fill rates of the two lines are normally distributed with equal variances.
Calculate the point estimate for the difference between the population means of the two lines.
(Multiple Choice)
4.9/5  (36)
(36)
When performing a hypothesis test for the difference between the means of two independent populations,where the standard deviations are known,the variances must be assumed equal.
(True/False)
4.9/5 (49)
A hypothesis test for the difference between two means is considered a two-tailed test when:
(Multiple Choice)
4.8/5 (43)
A PC company uses two suppliers for rechargeable batteries for its notebook computers.Two factors are important quality features of the batteries: mean use time and variation.It is desirable that the mean use time be high and the variability be low.Recently,the PC maker conducted a test on batteries from the two suppliers.In the test,9 randomly selected batteries from Supplier 1 were tested and 12 randomly selected batteries from Supplier 2 were tested.The following results were observed:
Supplier 1 Supplier 2
n1 = 9 n2 = 12  1 = 67.25 min.
  2 = 72.4 min.
S1= 11.2 min S2 = 9.9 min
Based on these sample results,can the PC maker conclude that a difference exists between the two batteries with respect to the population mean use time? Test using a 0.10 level of significance.
2 = 72.4 min.
S1= 11.2 min S2 = 9.9 min
Based on these sample results,can the PC maker conclude that a difference exists between the two batteries with respect to the population mean use time? Test using a 0.10 level of significance.
(Essay)
4.9/5 (38)
In comparing two populations using paired differences,after the difference is found for each pair,the method for testing whether the mean difference is equal to 0 becomes the same as was used for a one-sample hypothesis test with unknown standard deviation.
(True/False)
4.7/5 (36)
The NCAA is interested in estimating the difference in mean number of daily training hours for men and women athletes on college campuses.It wants 95 percent confidence and will select a sample of 10 men and 10 women for the study.The variances are assumed equal and the populations normally distributed.The sample results are:
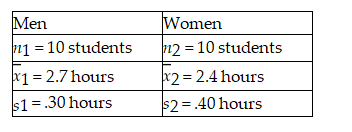 Based on these sample data,the estimate for the standard deviation of the sampling distribution is found by taking the square root of the sum of the two sample variances.
(True/False)
4.9/5 (42)
When conducting a hypothesis test to determine whether or not two groups differ,using paired samples rather than independent samples has the advantage of controlling for sources of variation that might distort the conclusions of the study.
(True/False)
4.9/5 (31)
The following samples are observations taken from the same elements at two different times: 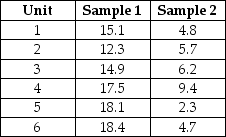 Assume that the populations are normally distributed and construct a 90% confidence interval for the difference in the means of the distribution at the times in which the samples were taken.
(Multiple Choice)
4.8/5 (37)
In estimating the difference between two population means,if a 95 percent confidence interval includes zero,then we can conclude that there is a 95 percent chance that the difference between the two population means is zero.
(True/False)
4.7/5 (41)
A decision maker wishes to test the following null and alternative hypotheses using an alpha level equal to 0.05: H0 : μ1 - μ2 = 0
HA : μ1 - μ2 ≠ 0
The population standard deviations are assumed to be known.After collecting the sample data,the test statistic is computed to be z = 1.78
Using the p-value approach,what decision should be reached about the null hypothesis?
(Multiple Choice)
4.8/5 (42)
There have been complaints recently from homeowners in the north end claiming that their homes have been assessed at values that are too high compare with other parts of town.They say that the mean increase from last year to this year has been higher in their part of town than elsewhere.To test this,the assessor's office staff plans to select a random sample of north end properties (group 1)and a random sample of properties from other areas within the city (group 2)and perform a hypothesis test.The following sample information is available:  Assuming that the null hypothesis will be tested using an alpha level equal to 0.05,what is the critical value?
(Multiple Choice)
4.8/5 (31)
If the point estimate in a paired difference estimation example does not fall in the resulting confidence interval,the decision maker can conclude that the two populations likely have different means.
(True/False)
4.9/5 (41)
An accounting firm has been hired by a large computer company to determine whether the proportion of accounts receivables with errors in one division (Division 1)exceeds that of the second division (Division 2).The managers believe that such a difference may exist because of the lax standards employed by the first division.To conduct the test,the accounting firm has selected random samples of accounts from each division with the following results.
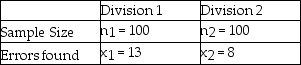 Based on this information and using a significance level equal to 0.05,the test statistic for the hypothesis test is approximately 1.153 and,therefore,the null hypothesis is not rejected.
(True/False)
4.9/5 (30)
The Cranston Hardware Company is interested in estimating the difference in the mean purchase for men customers versus women customers.It wishes to estimate this difference using a 95 percent confidence level.If the sample size is n = 10 from each population,the samples are independent,and sample standard deviations are used,and the variances are assumed equal,then the critical value will be t = 2.1009.
(True/False)
4.7/5 (28)
An Internet service provider is interested in estimating the proportion of homes in a particular community that have computers but do not already have Internet access.To do this,the company has selected a random sample of n = 200 homes and made calls.A total of 188 homes responded to the survey question with 38 saying that they had a computer with no Internet access.The 95 percent confidence interval estimate for the true population proportion is approximately 0.1447 - 0.2595.
(True/False)
4.8/5 (32)
The following information is based on independent random samples taken from two normally distributed populations having equal variances: 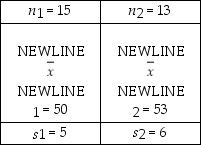 Based on the sample information,determine the 90% confidence interval estimate for the difference between the two population means.
(Multiple Choice)
4.8/5 (37)
A major U.S.oil company has developed two blends of gasoline.Managers are interested in determining whether a difference in mean gasoline mileage will be obtained from using the two blends.As part of their study,they have decided to run a test using the Chevrolet Impala automobile with automatic transmissions.They selected a random sample of 100 Impalas using Blend 1 and another 100 Impalas using Blend 2.Each car was first emptied of all the gasoline in its tank and then filled with the designated blend of the new gasoline.The car was then driven 200 miles on a specified route involving both city and highway roads.The cars were then filled and the actual miles per gallon were recorded.The following summary data were recorded:
Blend 1 Blend 2
Sample Size 100 100
Sample Mean 23.4 mpg 25.7 mpg
Sample St.Dev.4.0 mpg 4.2 mpg
Based on the sample data,using a 0.05 level of significance,what conclusion should the company reach about whether the population mean mpg is the same or different for the two blends? Use the test statistic approach to test the null hypothesis.
(Essay)
4.8/5 (37)
To find a confidence interval for the difference between the means of independent samples,when the variances are unknown but assumed equal,the sample sizes of the two groups must be the same.
(True/False)
4.9/5 (33)
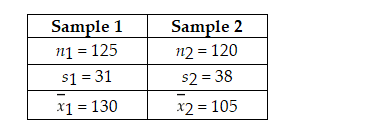
The U.S.Golf Association provides a number of services for its members.One of these is the evaluation of golf equipment to make sure that the equipment satisfies the rules of golf.For example,they regularly test the golf balls made by the various companies that sell balls in the United States.Recently they undertook a study of two brands of golf balls with the objective to see whether there is a difference in the mean distance that the two golf ball brands will fly off the tee.To conduct the test,the U.S.G.A.uses a robot named "Iron Byron," which swings the club at the same speed and with the same swing pattern each time it is used.The following data reflect sample data for a random sample of balls of each brand.  Given this information,what is the test statistic for testing whether the two population means are equal?
(Multiple Choice)
4.8/5 (31)
Given the following null and alternative hypotheses H0 : μ1 - μ2 = 0
HA : μ1 - μ2 ≠ 0
Together with the following sample information
 Develop the appropriate decision rule,assuming a significance level of 0.05 is to be used.
(Multiple Choice)
4.8/5 (44)
Filters
- Essay(0)
- Multiple Choice(0)
- Short Answer(0)
- True False(0)
- Matching(0)