Exam 10: Estimation and Hypothesis Testing for Two Population Parameters
Exam 1: The Where,Why,and How of Data Collection167 Questions
Exam 2: Graphs,Charts and Tablesdescribing Your Data139 Questions
Exam 3: Describing Data Using Numerical Measures138 Questions
Exam 4: Introduction to Probability125 Questions
Exam 5: Discrete Probability Distributions161 Questions
Exam 6: Introduction to Continuous Probability Distributions122 Questions
Exam 7: Introduction to Sampling Distributions136 Questions
Exam 8: Estimating Single Population Parameters174 Questions
Exam 9: Introduction to Hypothesis Testing183 Questions
Exam 10: Estimation and Hypothesis Testing for Two Population Parameters121 Questions
Exam 11: Hypothesis Tests and Estimation for Population Variances69 Questions
Exam 12: Analysis of Variance162 Questions
Exam 13: Goodness-Of-Fit Tests and Contingency Analysis105 Questions
Exam 14: Introduction to Linear Regression and Correlation Analysis139 Questions
Exam 15: Multiple Regression Analysis and Model Building152 Questions
Exam 16: Analyzing and Forecasting Time-Series Data133 Questions
Exam 17: Introduction to Nonparametric Statistics103 Questions
Exam 18: Introduction to Quality and Statistical Process Control43 Questions
Select questions type
Suppose as part of a national study of economic competitiveness a marketing research firm randomly sampled 200 adults between the ages of 27 and 35 living in metropolitan Seattle and 180 adults between the ages of 27 and 35 living in metropolitan Minneapolis.Each adult selected in the sample was asked,among other things,whether they had a college degree.From the Seattle sample 66 adults answered yes and from the Minneapolis sample 63 adults answered yes when asked if they had a college degree.Based on the sample data,can we conclude that there is a difference between the population proportions of adults between the ages of 27 and 35 in the two cities with college degrees? Use a level of significance of 0.10 to conduct the appropriate hypothesis test.
(Multiple Choice)
4.8/5  (45)
(45)
When performing a hypothesis test for the difference between the means of two independent populations where the standard deviations are known,it is necessary to use the pooled standard deviation in calculating the test statistic.
(True/False)
4.9/5 (37)
In estimating the difference between two population means based on small,independent samples from the two populations,two important assumptions are that the populations each be normally distributed and the populations have equal variances.
(True/False)
4.9/5 (46)
There are a number of highly touted search engines for finding things of interest on the Internet.Recently,a consumer rating system ranked two search engines ahead of the others.Now,a computer user's magazine wishes to make the final determination regarding which one is actually better at finding particular information.To do this,each search engine was used in an attempt to locate specific information using specified keywords.Both search engines were subjected to 100 queries.Search engine 1 successfully located the information 88 times and search engine 2 located the information 80 times.Using a significance level equal to 0.05,what is the critical value for the hypothesis test?
(Multiple Choice)
4.8/5 (39)
When estimating a confidence interval for the difference between 2 means using the method where sample variances are pooled,which of the following assumptions is not needed?
(Multiple Choice)
4.8/5 (33)
Given the following null and alternative hypotheses H0 : μ1 ≥ μ2
HA : μ1 < μ2
Together with the following sample information
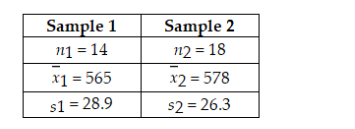 Assuming that the populations are normally distributed with equal variances,test at the 0.05 level of significance whether you would reject the null hypothesis based on the sample information.Use the test statistic approach.
(Multiple Choice)
4.8/5 (39)
Assume that 10 people join a weight loss program for 3 months.Each person's weight both before and after the program is recorded and the number of pounds each person lost is found.The following summarizes the results for the 10 people: Mean weight lost = 9 pounds
Sample standard deviation of weight lost = 4.6 pounds
Assume that the hypothesis test will be conducted to determine whether or not the weight loss program is effective using a 0.05 level of significance.What is the value of the test statistic?
(Multiple Choice)
4.8/5 (45)
The management of a department store is interested to estimate the difference in the amount of money spent by female and male shoppers.You are given the following information. 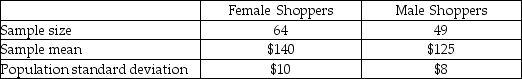 A 95 percent confidence interval estimate for the difference between the average purchases of the customers using the two different credit cards is:
(Multiple Choice)
4.7/5 (32)
Most companies that make golf balls and golf clubs use a one-armed robot named "Iron Byron" to test their balls for length and accuracy,but because of swing variations by real golfers,these test robots don't always indicate how the clubs will perform in actual use.One company in the golfing industry is interested in testing its new driver to see if has greater length off the tee than the best-selling driver.To do this,it has selected a group of golfers of differing abilities and ages.Its plan is to have each player use each of the two clubs and hit five balls.It will record the average length of the drives with each club for each player.The resulting data for a sample of 10 players is: 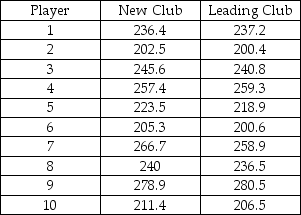 Based on these sample data,what is the point estimate for the difference between the mean distance for the new driver versus the leading driver?
(Multiple Choice)
4.9/5 (41)
If a manager wishes to develop a confidence interval estimate for estimating the difference between two population means,an increase in the size of the samples used will result in:
(Multiple Choice)
4.9/5 (39)
A major retail clothing store is interested in estimating the difference in mean monthly purchases by customers who use the store's in-house credit card versus using a Visa,Mastercard,or one of the other major credit cards.To do this,it has randomly selected a sample of customers who have made one or more purchases with each of the types of credit cards.The following represents the results of the sampling: 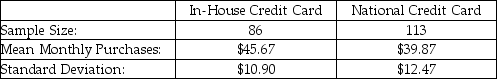 Suppose that the managers wished to test whether there is a statistical difference in the mean monthly purchases by customers using the two types of credit cards,using a significance level of .05,what is the value of the test statistic assuming the standard deviations are known?
(Multiple Choice)
4.7/5 (38)
A market research firm has come up with two coupon designs that could be inserted into the envelopes that go out with the monthly statement to credit card customers.The coupons offer the customer an opportunity to become a member of a travel club.The research firm is interested in estimating the difference in proportion of customers who will join the club after receiving one or the other of the two coupons.To obtain this estimate,the research firm has sent out coupon design 1 to a random sample of 100 customers.A second random sample of 100 customers received coupon 2.For the first coupon,11 customers joined the travel club,while 15 customers who received coupon 2 joined.Based upon this sample information,develop and interpret the desired 95 percent confidence interval estimate.
(Essay)
4.8/5 (34)
There is interest at the American Savings and Loan as to whether there is a difference between average daily balances in checking accounts that are joint accounts (two or more members per account)versus single accounts (one member per account).To test this,a random sample of checking accounts was selected with the following results:
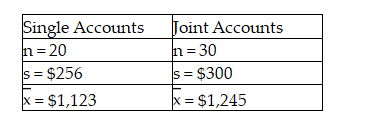 Based upon these data,assuming that the populations are normally distributed with equal variances,the test statistic for testing whether the two populations have equal means is approximately -1.49.
(True/False)
4.8/5 (31)
A company in Maryland has developed a device that can be attached to car engines,which it believes will increase the miles per gallon that cars will get.The owners are interested in estimating the difference between mean mpg for cars using the device versus those that are not using the device.The following data represent the mpg for independent random samples of cars from each population.The variances are assumed equal and the populations normally distributed. 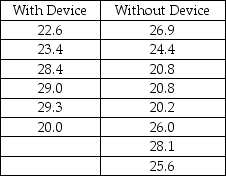 Given this data,what is the critical value if the owners wish to have a 90 percent confidence interval estimate?
(Multiple Choice)
4.9/5 (43)
The NCAA is interested in estimating the difference in mean number of daily training hours for men and women athletes on college campuses.They want 95 percent confidence and will select a sample of 10 men and 10 women for the study.The sample results are:
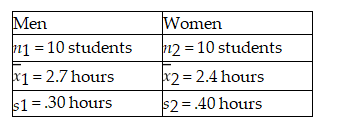 Based on these data,the point estimate is .30 hours.
(True/False)
4.7/5 (28)
The Cranston Hardware Company is interested in estimating the difference in the mean purchase for men customers versus women customers.It wishes to estimate this difference using a 95 percent confidence level.Assume that the variances are equal and the populations normally distributed.The following data represent independent samples from each population:
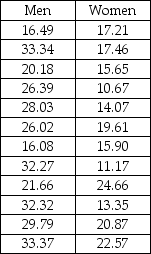 Based on these data,the company can conclude that there is a statistical difference between men and women with regard to mean spending at the hardware store with men tending to spend more on average than women.
(True/False)
4.8/5 (46)
A major manufacturer of home electronics is interested in determining whether customers have a preference between two new speaker designs for their home entertainment centers.To test this,the design department manager has selected a random sample of customers and shown them the first design.A second sample of customers is shown design 2.The manager then asks each customer whether they prefer the new design they were shown over the one they currently own.The following results were observed:
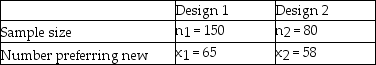 Based on these data and a significance level equal to 0.05,the appropriate null and alternative hypotheses are:
H0 :
Based on these data and a significance level equal to 0.05,the appropriate null and alternative hypotheses are:
H0 :  1 ≥
1 ≥  2
Ha :
2
Ha :  1 <
1 <  2
2
(True/False)
4.9/5 (31)
A real estate agent believes that home with swimming pools take longer to sell than home without swimming pools.A random sample of each type of recently sold homes was taken where the number of days on the market is recorded.Results are:
Homes with pool Homes w/o pool
Sample mean 77 days 65 days
Sample Standard deviation 8.4 days 7.2 days
Sample size 19 23
Assuming that the populations are normally distributed and the variances are equal,conduct the appropriate hypothesis test to determine if the real estate agent is correct.Use the 0.05 level of significance.
(Essay)
4.8/5 (38)
A major U.S.oil company has developed two blends of gasoline.Managers are interested in determining whether a difference in mean gasoline mileage will be obtained from using the two blends.As part of their study,they have decided to run a test using the Chevrolet Impala automobile with automatic transmissions.They selected a random sample of 100 Impalas using Blend 1 and another 100 Impalas using Blend 2.Each car was first emptied of all the gasoline in its tank and then filled with the designated blend of the new gasoline.The car was then driven 200 miles on a specified route involving both city and highway roads.The cars were then filled and the actual miles per gallon were recorded.The following summary data were recorded:
Blend 1 Blend 2
Sample Size 100 100
Sample Mean 23.4 mpg 25.7 mpg
Sample St.Dev.4.0 mpg 4.2 mpg
Based on the sample data,using a 0.05 level of significance,what conclusion should the company reach about whether the population mean mpg is the same or different for the two blends? Use the p-value approach to test the null hypothesis.
(Essay)
4.8/5 (34)
A study was recently conducted at a major university to determine whether there is a difference in the proportion of business school graduates who go on to graduate school within five years after graduation and the proportion of non-business school graduates who attend graduate school.A random sample of 400 business school graduates showed that 75 had gone to graduate school while in a random sample of 500 non-business graduates,137 had gone on to graduate school.Based on these sample data,and testing at the 0.10 level of significance,what is the value of the test statistic?
(Multiple Choice)
4.9/5 (37)
Filters
- Essay(0)
- Multiple Choice(0)
- Short Answer(0)
- True False(0)
- Matching(0)