Exam 10: Estimation and Hypothesis Testing for Two Population Parameters
Exam 1: The Where,Why,and How of Data Collection167 Questions
Exam 2: Graphs,Charts and Tablesdescribing Your Data139 Questions
Exam 3: Describing Data Using Numerical Measures138 Questions
Exam 4: Introduction to Probability125 Questions
Exam 5: Discrete Probability Distributions161 Questions
Exam 6: Introduction to Continuous Probability Distributions122 Questions
Exam 7: Introduction to Sampling Distributions136 Questions
Exam 8: Estimating Single Population Parameters174 Questions
Exam 9: Introduction to Hypothesis Testing183 Questions
Exam 10: Estimation and Hypothesis Testing for Two Population Parameters121 Questions
Exam 11: Hypothesis Tests and Estimation for Population Variances69 Questions
Exam 12: Analysis of Variance162 Questions
Exam 13: Goodness-Of-Fit Tests and Contingency Analysis105 Questions
Exam 14: Introduction to Linear Regression and Correlation Analysis139 Questions
Exam 15: Multiple Regression Analysis and Model Building152 Questions
Exam 16: Analyzing and Forecasting Time-Series Data133 Questions
Exam 17: Introduction to Nonparametric Statistics103 Questions
Exam 18: Introduction to Quality and Statistical Process Control43 Questions
Select questions type
The Sergio Lumber Company manufactures plywood.One step in the process is the one where the veneer is dried by passing through a huge dryer (similar to an oven)where much of the moisture in the veneer is extracted.At the end of this step,samples of veneer are tested for moisture content.It is believed that pine veneer will be less moist on average than will fir veneer.The following data were reported recently where the values represent the percent moisture in the wood:
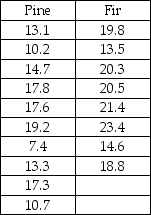 Based on these data,the critical t value from the t-distribution will be 1.7459 if the significance level is set at 0.05 and variances are presumed equal.
(True/False)
5.0/5  (39)
(39)
In conducting a hypothesis test for the difference between two population means where the standard deviations are known and the null hypothesis is: H0 : μA - μβ ≥ 0
What is the p-value assuming that the test statistic has been found to be z = 2.52?
(Multiple Choice)
4.7/5 (38)
An accounting firm has been hired by a large computer company to determine whether the proportion of accounts receivables with errors in one division (Division 1)exceeds that of the second division (Division 2).The managers believe that such a difference may exist because of the lax standards employed by the first division.The null and alternative hypotheses that will be tested are:
H0 : μ1 ≥ μ2
Ha : μ1 < μ2
(True/False)
4.8/5 (28)
Given the following null and alternative hypotheses H0 : μ1 - μ2 = 0
HA : μ1 - μ2 ≠ 0
Together with the following sample information
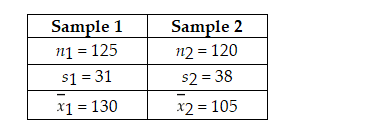 Test the null hypothesis and indicate whether the sample information leads you to reject or fail to reject the null hypothesis,assuming a significance level of 0.05 is to be used.Use the test statistic approach.
(Multiple Choice)
4.9/5 (49)
In estimating a confidence interval for the difference between two means,when the samples are independent and the standard deviations are unknown,it can be acceptable for there to be small violations of the assumptions of normality and equal variances,especially when the sample sizes are equal.
(True/False)
4.8/5 (36)
The t-distribution is still applicable even when there are small violations of the assumptions for the case when the variances for two populations are unknown.This is particularly true when the sample sizes are approximately equal.
(True/False)
4.9/5 (36)
When estimating the difference between two population means,when should the normal distribution be used and when should the t-distribution be used?
(Essay)
4.9/5 (40)
If we are testing for the difference between the means of two paired populations with samples of n1 = 20 and n2 = 20,the number of degrees of freedom is equal to:
(Multiple Choice)
4.9/5 (27)
A company in Maryland has developed a device that can be attached to car engines,which it believes will increase the miles per gallon that cars will get.The owners are interested in estimating the difference between mean mpg for cars using the device versus those that are not using the device.The following data represent the mpg for random independent samples of cars from each population.The variances are assumed equal and the populations normally distributed. 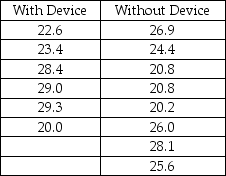 Given this data,what is the upper limit for a 95 percent confidence interval estimate for the difference in mean mpg?
(Multiple Choice)
4.8/5 (43)
Given the following information,calculate the degrees of freedom that should be used in the pooled-standard deviation t-test. 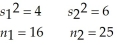
(Multiple Choice)
4.9/5 (34)
The National Football League (NFL)is interested in testing to see whether there is a difference in the proportion of male fans that prefer instant replay to review officials' calls and the proportion of female fans that prefer instant replay.It is believed that males tend to favor the practice to a higher degree than do females.To test this,random samples of male fans and female fans were selected and the following results were obtained:
Male Fans Female Fans
Sample size 300 100
Number Preferring 234 57
Using a significance level equal to 0.05,what conclusion should be reached based on the sample data?
(Essay)
4.8/5 (45)
A direct retailer that sells clothing on the Internet has two distribution centers and wants to determine if there is a difference between the proportion of customer order shipments that contain errors (wrong color,wrong size,etc. ).It calculates a 95 percent confidence interval on the difference in the sample proportions to be -0.012 to 0.037.Based on this,it can conclude that the distribution centers differ significantly for the proportion of orders with errors.
(True/False)
4.9/5 (35)
If we are testing for the difference between the means of two independent populations with samples of n1 = 20 and n2 = 20,the number of degrees of freedom is equal to:
(Multiple Choice)
4.8/5 (34)
A decision maker wishes to test the following null and alternative hypotheses using an alpha level equal to 0.05: H0 : μ1 - μ2 = 0
HA : μ1 - μ2 ≠ 0
The population standard deviations are assumed to be known.After collecting the sample data,the test statistic is computed to be z = 1.78
Using the test statistic approach,what conclusion should be reached about the null hypothesis?
(Multiple Choice)
4.9/5 (35)
You are given the following results of a paired-difference test:  = -4.6 sd = 0.25
N = 16
Construct a 99% confidence interval estimate for the paired difference in mean values.
= -4.6 sd = 0.25
N = 16
Construct a 99% confidence interval estimate for the paired difference in mean values.
(Multiple Choice)
4.9/5 (29)
To find the pooled standard deviation involves taking a weighted average of the two sample variances,then finding its square root.
(True/False)
4.8/5 (39)
The t-test for the mean difference between 2 related populations assumes that the respective:
(Multiple Choice)
4.8/5 (31)
A study was recently conducted at a major university to estimate the difference in the proportion of business school graduates who go on to graduate school within five years after graduation and the proportion of non-business school graduates who attend graduate school.A random sample of 400 business school graduates showed that 75 had gone to graduate school while in a random sample of 500 non-business graduates,137 had gone on to graduate school.Based on a 95 percent confidence level,what is the upper limit of the confidence interval estimate?
(Multiple Choice)
4.8/5 (37)
A paired sample study has been conducted to determine whether two populations have equal means.Twenty paired samples were obtained with the following sample results: 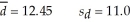 Based on these sample data and a significance level of 0.05,what conclusion should be made about the population means?
(Multiple Choice)
4.8/5 (35)
The Cranston Hardware Company is interested in estimating the difference in the mean purchase for men customers versus women customers.It wishes to estimate this difference using a 95 percent confidence level.Assume that the variances are equal and the populations normally distributed.The following data represent independent samples from each population:
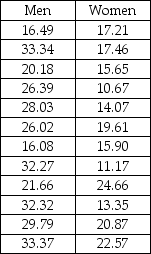 Based on these data,the upper limit of the interval estimate is approximately $13.82.
(True/False)
4.7/5 (37)
Filters
- Essay(0)
- Multiple Choice(0)
- Short Answer(0)
- True False(0)
- Matching(0)