Exam 16: Time Series and Forecasting
Exam 1: What Is Statistics79 Questions
Exam 2: Describing Data: Frequency Tables, Frequency Distributions, and Graphic Presentation129 Questions
Exam 3: Describing Data: Numerical Measures132 Questions
Exam 4: Describing Data: Displaying and Exploring Data108 Questions
Exam 5: A Survey of Probability Concepts130 Questions
Exam 6: Discrete Probability Distributions128 Questions
Exam 7: Continuous Probability Distributions131 Questions
Exam 8: Sampling Methods and the Central Limit Theorem115 Questions
Exam 9: Estimation and Confidence Intervals129 Questions
Exam 10: One-Sample Tests of Hypothesis134 Questions
Exam 11: Two-Sample Tests of Hypothesis130 Questions
Exam 12: Analysis of Variance128 Questions
Exam 13: Correlation and Linear Regression130 Questions
Exam 14: Multiple Regression Analysis129 Questions
Exam 15: Index Numbers129 Questions
Exam 16: Time Series and Forecasting129 Questions
Exam 17: Nonparametric Methods: Goodness-Of-Fit Tests129 Questions
Exam 18: Nonparametric Methods: Analysis of Ranked Data129 Questions
Exam 19: Statistical Process Control and Quality Management129 Questions
Exam 20: An Introduction to Decision Theory115 Questions
Select questions type
If a major hurricane exerts an impact on the economy, that event could be classified as:
(Multiple Choice)
5.0/5  (35)
(35)
The range of possible values for the Durbin-Watson statistic is
(Multiple Choice)
4.9/5 (38)
Episodic and residual variations can be projected into the future.
(True/False)
4.8/5 (35)
A set of typical seasonal indexes is very useful in adjusting a time series for seasonal fluctuations. What is the resulting time series called? _____________________________
(Short Answer)
4.8/5 (36)
Product sales since 1999 are:  The least squares trend equation is given as
Ŷ = 265.12 - 21.18t, where t is set equal to one for 1999.
On average, how much did sales change per year from 1999 to 2007?
The least squares trend equation is given as
Ŷ = 265.12 - 21.18t, where t is set equal to one for 1999.
On average, how much did sales change per year from 1999 to 2007?
(Short Answer)
4.8/5 (38)
Why are long range predictions considered essential to managing a firm?
(Multiple Choice)
4.8/5 (31)
If the past data approximates a straight line, the equation used is Ŷ = a + bt, where a is the Y-intercept and b is the slope of the line.
(True/False)
4.9/5 (37)
To calculate monthly typical seasonal indexes, how many periods are included in the ratio-to-moving-average method?
(Multiple Choice)
4.8/5 (34)
If the least squares equation for sales data going from 2004 to 2008 is Ŷ = 10 + 1.3t (in $millions), what is the value of t and the forecast for 2010?
(Multiple Choice)
4.8/5 (47)
Product sales since 1999 are:  The least squares trend equation is given as
Ŷ = 265.12 - 21.18t, where t is set equal to one for 1999.
What is the 3 year moving average for 1999-2001?
The least squares trend equation is given as
Ŷ = 265.12 - 21.18t, where t is set equal to one for 1999.
What is the 3 year moving average for 1999-2001?
(Short Answer)
4.9/5 (37)
A linear trend equation is used to represent time series values when the data are changing by equal?
(Multiple Choice)
4.8/5 (34)
A plastics manufacturer performed a quarterly time series analysis for demands over the last five years (periods 1 through 20). The analysis resulted in the following trend equation and seasonal indexes:
Ŷ = 920.0 + 22.6t 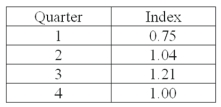 Using the trend line equation and the seasonal indexes, predict demand for the third period of the next year, i.e., period 23.
(Short Answer)
4.8/5 (32)
A logarithmic trend equation should be used when the time series trend is:
(Multiple Choice)
4.7/5 (37)
A plastics manufacturer performed a quarterly time series analysis for demands over the last five years (periods 1 through 20). The analysis resulted in the following trend equation and seasonal indexes:  = 920.0 + 22.6 t
 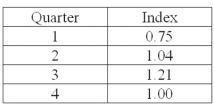 Based on the seasonal indexes, which quarter is expected to have 21% more demand than predicted by the trend line?
(Short Answer)
4.8/5 (28)
For a five-year moving average, how many values will be lost at the beginning and end of the time series?
(Multiple Choice)
4.8/5 (44)
A resort hotel performed a quarterly time series analysis for demands over the last five years (periods 1 through 20). The analysis resulted in the following trend equation and seasonal indexes:
Ŷ = 1000 + 150t 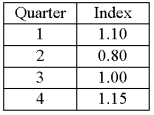 The seasonal indexes have:
(Short Answer)
4.9/5 (41)
When a time series is non-linear, suggest a method for transforming the data so that the least squares method can be applied.
(Essay)
5.0/5 (43)
What is the general equation for the logarithmic trend equation to forecast Ŷ?
(Multiple Choice)
4.7/5 (34)
If the exports (in $millions) for the period 2006 through 2010 were $878, $892, $864, $870 and $912 respectively, what are these values called?
(Multiple Choice)
4.9/5 (37)
If time series data are plotted on graph paper having an arithmetic scale that increases or decreases by equal percents, how will the graph look?
(Multiple Choice)
5.0/5 (35)
Filters
- Essay(0)
- Multiple Choice(0)
- Short Answer(0)
- True False(0)
- Matching(0)