Exam 16: Time Series and Forecasting
Exam 1: What Is Statistics79 Questions
Exam 2: Describing Data: Frequency Tables, Frequency Distributions, and Graphic Presentation129 Questions
Exam 3: Describing Data: Numerical Measures132 Questions
Exam 4: Describing Data: Displaying and Exploring Data108 Questions
Exam 5: A Survey of Probability Concepts130 Questions
Exam 6: Discrete Probability Distributions128 Questions
Exam 7: Continuous Probability Distributions131 Questions
Exam 8: Sampling Methods and the Central Limit Theorem115 Questions
Exam 9: Estimation and Confidence Intervals129 Questions
Exam 10: One-Sample Tests of Hypothesis134 Questions
Exam 11: Two-Sample Tests of Hypothesis130 Questions
Exam 12: Analysis of Variance128 Questions
Exam 13: Correlation and Linear Regression130 Questions
Exam 14: Multiple Regression Analysis129 Questions
Exam 15: Index Numbers129 Questions
Exam 16: Time Series and Forecasting129 Questions
Exam 17: Nonparametric Methods: Goodness-Of-Fit Tests129 Questions
Exam 18: Nonparametric Methods: Analysis of Ranked Data129 Questions
Exam 19: Statistical Process Control and Quality Management129 Questions
Exam 20: An Introduction to Decision Theory115 Questions
Select questions type
The table below shows the sales for a plastics manufacturer recorded over the past year. The seasonal indexes for each quarter are also provided. To track the trend for these four quarters, use the indexes to deseasonalize the sales data 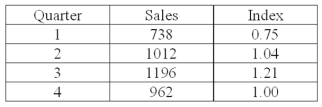 What is the deseasonalized sales value for quarter 1?
(Short Answer)
4.8/5  (34)
(34)
In a time series, economic periods of prosperity followed by recession are described as:
(Multiple Choice)
4.8/5 (41)
The forecast for the third quarter is 2,000 units; the seasonal index for the quarter is 0.79. What are the seasonally adjusted sales for the quarter?
(Multiple Choice)
4.7/5 (35)
The forecast for the third quarter is 1,000 units; the seasonal index for the quarter is 1.10. What are the seasonally adjusted sales for the quarter?
(Multiple Choice)
4.8/5 (34)
A resort hotel performed a quarterly time series analysis for demands over the last five years (periods 1 through 20). The analysis resulted in the following trend equation and seasonal indexes:
Ŷ = 1000 + 150t 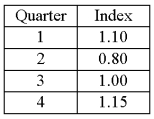 Based on the seasonal indexes, which quarter is expected to have 15% more demand than predicted by the trend line?
(Short Answer)
4.9/5 (42)
The Durbin-Watson statistic is used to test for correlated residuals.
(True/False)
4.8/5 (41)
What is the logarithmic transformation for the equation: Ŷ = a + bt?
(Multiple Choice)
4.8/5 (43)
Product sales since 1999 are:  The least squares trend equation is given as
Ŷ = 265.12 - 21.18t, where t is set equal to one for 1999.
What are the predicted sales for 2009?
The least squares trend equation is given as
Ŷ = 265.12 - 21.18t, where t is set equal to one for 1999.
What are the predicted sales for 2009?
(Short Answer)
4.8/5 (34)
A graph of a deseasonalized time series does NOT show ________.
(Short Answer)
4.9/5 (35)
For the trend equation, log Ŷ = log (a) + log (b t), the time series is _____.
(Short Answer)
4.8/5 (40)
The table below shows the sales for a resort hotel recorded over the past year. The seasonal indexes for each quarter are also provided. To track the trend for these four quarters, use the indexes to deseasonalize the sales data 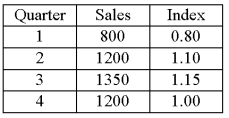 What is the deseasonalized sales value for quarter 1?
(Short Answer)
4.8/5 (40)
What is the long-term behavior of a variable over an extended period of time called?
(Multiple Choice)
4.9/5 (41)
For the third quarter, the sales are 2,500 units; the seasonal index for the quarter is 1.20. What are the deseasonalized sales for the quarter?
(Multiple Choice)
4.8/5 (36)
Product sales since 2001 are: 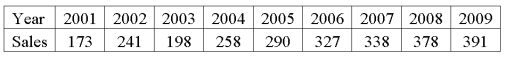 The least squares trend equation is given as
Ŷ = 100 + 28t, where t is set equal to one for 2001.
What were the predicted sales in 2006?
The least squares trend equation is given as
Ŷ = 100 + 28t, where t is set equal to one for 2001.
What were the predicted sales in 2006?
(Short Answer)
4.7/5 (30)
To study the trend and cycle components of a time series, typical seasonal indexes are used to compute ____.
(Short Answer)
4.7/5 (26)
Which one of the following is not a component of a time series?
(Multiple Choice)
4.8/5 (38)
For the third quarter, the sales are 1,500 units; the seasonal index for the quarter is 0.90. What are the deseasonalized sales for the quarter?
(Multiple Choice)
4.7/5 (31)
Filters
- Essay(0)
- Multiple Choice(0)
- Short Answer(0)
- True False(0)
- Matching(0)