Exam 2: Describing Data: Frequency Tables, Frequency Distributions, and Graphic Presentation
Exam 1: What Is Statistics79 Questions
Exam 2: Describing Data: Frequency Tables, Frequency Distributions, and Graphic Presentation129 Questions
Exam 3: Describing Data: Numerical Measures132 Questions
Exam 4: Describing Data: Displaying and Exploring Data108 Questions
Exam 5: A Survey of Probability Concepts130 Questions
Exam 6: Discrete Probability Distributions128 Questions
Exam 7: Continuous Probability Distributions131 Questions
Exam 8: Sampling Methods and the Central Limit Theorem115 Questions
Exam 9: Estimation and Confidence Intervals129 Questions
Exam 10: One-Sample Tests of Hypothesis134 Questions
Exam 11: Two-Sample Tests of Hypothesis130 Questions
Exam 12: Analysis of Variance128 Questions
Exam 13: Correlation and Linear Regression130 Questions
Exam 14: Multiple Regression Analysis129 Questions
Exam 15: Index Numbers129 Questions
Exam 16: Time Series and Forecasting129 Questions
Exam 17: Nonparametric Methods: Goodness-Of-Fit Tests129 Questions
Exam 18: Nonparametric Methods: Analysis of Ranked Data129 Questions
Exam 19: Statistical Process Control and Quality Management129 Questions
Exam 20: An Introduction to Decision Theory115 Questions
Select questions type
If the number of observations is 124, calculate the suggested number of classes using the "2 to the k rule" _______________________.
(Short Answer)
4.8/5  (30)
(30)
Refer to the following frequency distribution on days absent during a calendar year by employees of a manufacturing company: 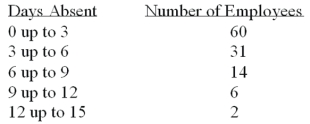 How many employees were absent fewer than six days?
(Multiple Choice)
5.0/5 (36)
In frequency distributions, classes are mutually exclusive if each individual, object, or measurement is included in only one category.
(True/False)
4.8/5 (32)
What is the difference between a frequency distribution and a cumulative frequency distribution?
(Essay)
4.9/5 (35)
To summarize the gender of students attending a college in a frequency distribution, how many classes would be required? ________________
(Short Answer)
4.8/5 (35)
In a relative frequency distribution, the sum of the relative class frequencies is ______________________.
(Short Answer)
4.8/5 (31)
To construct a bar chart, the class frequencies are plotted on the _________________
(Short Answer)
4.8/5 (37)
A data set consists of 40 observations. For a quantitative variable, how many classes would you recommend for the frequency distribution? _______
(Short Answer)
4.8/5 (38)
The following frequency distribution shows the distribution of delivery times (in days) for swimstuff.com customer orders during the last month. 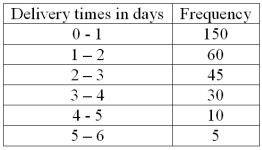 For 300 observations, our rule-of-thumb for number of classes would indicate 9 classes. In this case what is the class interval and why would it be reasonable to use that class interval and only 6 classes?
(Essay)
4.8/5 (34)
Monthly commissions of first-year insurance brokers are $1,270, $1,310, $1,680, $1,380, $1,410, $1,570, $1,180 and $1,420. These figures are referred to as:
(Multiple Choice)
4.8/5 (30)
The following frequency distribution shows the distribution of delivery times (in days) for swimstuff.com customer orders during the last month. 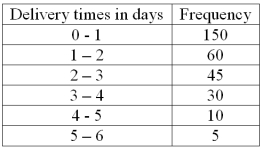 What is the relative frequency for orders delivered in three days or more?
(Short Answer)
5.0/5 (30)
Refer to the following distribution of commissions: 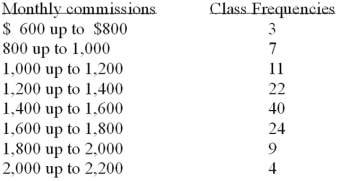 For the distribution above, what is the midpoint of the class with the greatest frequency?
(Multiple Choice)
4.8/5 (34)
Refer to the following breakdown of responses to a survey of "Are you concerned about being tracked while connected to the Internet"? 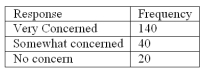 What type of chart should be used to describe the frequency table?
(Multiple Choice)
4.8/5 (35)
Refer to the following breakdown of responses to a survey of room cleanliness in a hotel. 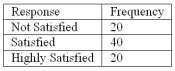 Draw a bar graph that illustrates the relative frequencies.
(Essay)
4.7/5 (40)
Refer to the following distribution of commissions: 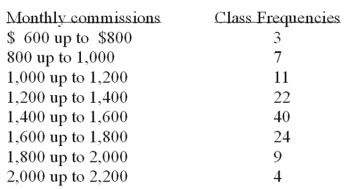 The first coordinate for a cumulative frequency distribution would be:
(Multiple Choice)
4.8/5 (33)
Refer to the following breakdown of responses to a survey of room service in a hotel. 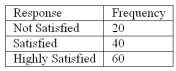 What is the class interval for the frequency table above?
(Multiple Choice)
4.9/5 (37)
Refer to the following class marks or midpoints for a frequency distribution of "weights of college men" recorded to the nearest pound:
The first three class marks are 105, 115, and 125.
What is the upper limit for the third class? _______
(Short Answer)
4.8/5 (39)
A cumulative frequency distribution is used when we want to determine how many observations lie above or below certain values.
(True/False)
4.8/5 (33)
Filters
- Essay(0)
- Multiple Choice(0)
- Short Answer(0)
- True False(0)
- Matching(0)