Exam 2: Describing Data: Frequency Tables, Frequency Distributions, and Graphic Presentation
Exam 1: What Is Statistics79 Questions
Exam 2: Describing Data: Frequency Tables, Frequency Distributions, and Graphic Presentation129 Questions
Exam 3: Describing Data: Numerical Measures132 Questions
Exam 4: Describing Data: Displaying and Exploring Data108 Questions
Exam 5: A Survey of Probability Concepts130 Questions
Exam 6: Discrete Probability Distributions128 Questions
Exam 7: Continuous Probability Distributions131 Questions
Exam 8: Sampling Methods and the Central Limit Theorem115 Questions
Exam 9: Estimation and Confidence Intervals129 Questions
Exam 10: One-Sample Tests of Hypothesis134 Questions
Exam 11: Two-Sample Tests of Hypothesis130 Questions
Exam 12: Analysis of Variance128 Questions
Exam 13: Correlation and Linear Regression130 Questions
Exam 14: Multiple Regression Analysis129 Questions
Exam 15: Index Numbers129 Questions
Exam 16: Time Series and Forecasting129 Questions
Exam 17: Nonparametric Methods: Goodness-Of-Fit Tests129 Questions
Exam 18: Nonparametric Methods: Analysis of Ranked Data129 Questions
Exam 19: Statistical Process Control and Quality Management129 Questions
Exam 20: An Introduction to Decision Theory115 Questions
Select questions type
In a bar chart, why are there spaces between the bars on the horizontal axis?
(Essay)
4.8/5  (33)
(33)
A student was interested in the cigarette smoking habits of college students and collected data from an unbiased random sample of students. The data is summarized in the following table: 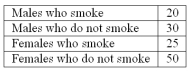 What type of chart best represents relative class frequencies?
(Multiple Choice)
4.7/5 (33)
Refer to the following frequency distribution on days absent during a calendar year by employees of a manufacturing company: 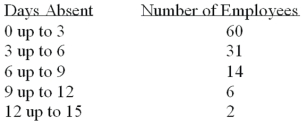 How many employees were absent six days or more?
(Multiple Choice)
4.9/5 (33)
To convert a frequency distribution to a relative frequency distribution, divide each class frequency by the number of classes.
(True/False)
4.8/5 (28)
A data set has 100 observations. In the data, a quantitative variable's highest value is 117 and its lowest value is 47. What is the minimum class interval that you would recommend? _____________
(Essay)
4.8/5 (33)
Refer to the following frequency distribution on days absent during a calendar year by employees of a manufacturing company: 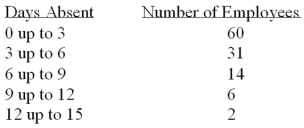 How many employees were absent from 6 up to 12 days?
(Multiple Choice)
4.9/5 (31)
A class interval, which is the width of a class, can be determined by subtracting the lower limit of a class from the lower limit of the next higher class.
(True/False)
4.8/5 (28)
Refer to the following breakdown of responses to a survey of "Are you concerned about being tracked while connected to the Internet"? 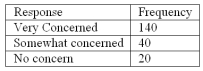 What percent of the responses indicated that users were somewhat concerned?
(Multiple Choice)
4.9/5 (32)
In a cumulative frequency distribution, what percent of the total frequencies would fall below the upper limit of the highest class? ______
(Short Answer)
4.7/5 (37)
Refer to the following class marks or midpoints for a frequency distribution of "weights of college men" recorded to the nearest pound:
The first three class marks are 105, 115, and 125.
What are the class limits for the fourth class? _______ and _______
(Short Answer)
4.9/5 (37)
Refer to the following distribution of commissions: 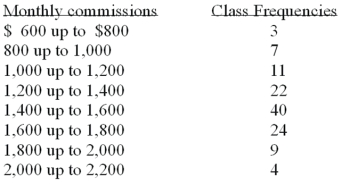 What is the class interval?
(Multiple Choice)
4.8/5 (48)
A class relative frequency represents a __________ of the total observations in the class.
(Short Answer)
4.8/5 (34)
Refer to the following ages (rounded to the nearest whole year) of employees at a large company that were grouped into a distribution with class limits:
20 up to 30
30 up to 40
40 up to 50
50 up to 60
60 up to 70
What is the class interval? ______
(Short Answer)
4.7/5 (40)
Refer to the following frequency distribution on days absent during a calendar year by employees of a manufacturing company: 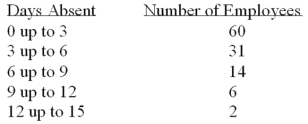 How many employees were absent between 3 up to 6 days?
(Multiple Choice)
4.8/5 (33)
Refer to the following class marks or midpoints for a frequency distribution of "weights of college men" recorded to the nearest pound:
The first three class marks are 105, 115, and 125.
What is the class interval? _____
(Short Answer)
4.8/5 (35)
In a frequency distribution, a class defined as "Under $100" and "$1,000 and over" is called an _____________________.
(Short Answer)
4.9/5 (33)
The midpoint of a class interval is also called a class __________.
(Short Answer)
4.8/5 (30)
Refer to the following distribution of commissions: 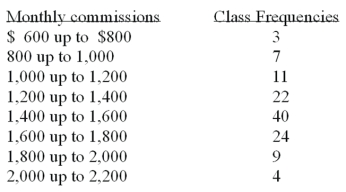 What is the relative frequency for those salespersons that earn from $1,600 up to $1,800?
(Multiple Choice)
4.9/5 (34)
Refer to the following distribution of commissions: 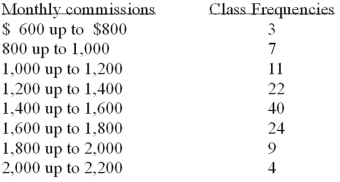 What is the relative frequency of those salespersons that earn $1,600 or more?
(Multiple Choice)
4.8/5 (27)
Filters
- Essay(0)
- Multiple Choice(0)
- Short Answer(0)
- True False(0)
- Matching(0)