Exam 2: Describing Data: Frequency Tables, Frequency Distributions, and Graphic Presentation
Exam 1: What Is Statistics79 Questions
Exam 2: Describing Data: Frequency Tables, Frequency Distributions, and Graphic Presentation129 Questions
Exam 3: Describing Data: Numerical Measures132 Questions
Exam 4: Describing Data: Displaying and Exploring Data108 Questions
Exam 5: A Survey of Probability Concepts130 Questions
Exam 6: Discrete Probability Distributions128 Questions
Exam 7: Continuous Probability Distributions131 Questions
Exam 8: Sampling Methods and the Central Limit Theorem115 Questions
Exam 9: Estimation and Confidence Intervals129 Questions
Exam 10: One-Sample Tests of Hypothesis134 Questions
Exam 11: Two-Sample Tests of Hypothesis130 Questions
Exam 12: Analysis of Variance128 Questions
Exam 13: Correlation and Linear Regression130 Questions
Exam 14: Multiple Regression Analysis129 Questions
Exam 15: Index Numbers129 Questions
Exam 16: Time Series and Forecasting129 Questions
Exam 17: Nonparametric Methods: Goodness-Of-Fit Tests129 Questions
Exam 18: Nonparametric Methods: Analysis of Ranked Data129 Questions
Exam 19: Statistical Process Control and Quality Management129 Questions
Exam 20: An Introduction to Decision Theory115 Questions
Select questions type
To construct a pie chart, the class frequencies are converted to __________________
(Short Answer)
4.7/5  (28)
(28)
Refer to the following breakdown of responses to a survey of room cleanliness in a hotel. 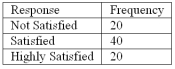 What percent of the responses indicated that customers were satisfied?
(Short Answer)
4.8/5 (35)
A small sample of computer operators shows monthly incomes of $1,950, $1,775, $2,060, $1,840, $1,795, $1,890, $1,925 and $1,810. What are these ungrouped numbers called?
(Multiple Choice)
4.8/5 (40)
In a bar chart, the x-axis is labeled with the values of a qualitative variable.
(True/False)
4.9/5 (30)
A frequency polygon is a very useful graphic technique when comparing two or more distributions.
(True/False)
4.9/5 (41)
Refer to the following breakdown of responses to a survey of "How confident are you that you saved enough to retire"? 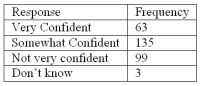 What is the class interval for the frequency table above?
(Multiple Choice)
4.8/5 (37)
Refer to the following information from a frequency distribution for "heights of college women" recorded to the nearest inch: The first two class midpoints are 62.5" and 65.5".
What are the class limits for the third class?
(Multiple Choice)
4.8/5 (30)
Refer to the following breakdown of responses to a survey of "How confident are you that you saved enough to retire"? 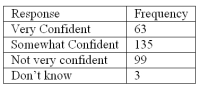 What is the class with the greatest frequency?
(Multiple Choice)
5.0/5 (37)
For the following distribution of heights, what are the limits for the class with the greatest frequency? 
(Multiple Choice)
4.8/5 (41)
Filters
- Essay(0)
- Multiple Choice(0)
- Short Answer(0)
- True False(0)
- Matching(0)