Exam 2: Describing Data: Frequency Tables, Frequency Distributions, and Graphic Presentation
Exam 1: What Is Statistics79 Questions
Exam 2: Describing Data: Frequency Tables, Frequency Distributions, and Graphic Presentation129 Questions
Exam 3: Describing Data: Numerical Measures132 Questions
Exam 4: Describing Data: Displaying and Exploring Data108 Questions
Exam 5: A Survey of Probability Concepts130 Questions
Exam 6: Discrete Probability Distributions128 Questions
Exam 7: Continuous Probability Distributions131 Questions
Exam 8: Sampling Methods and the Central Limit Theorem115 Questions
Exam 9: Estimation and Confidence Intervals129 Questions
Exam 10: One-Sample Tests of Hypothesis134 Questions
Exam 11: Two-Sample Tests of Hypothesis130 Questions
Exam 12: Analysis of Variance128 Questions
Exam 13: Correlation and Linear Regression130 Questions
Exam 14: Multiple Regression Analysis129 Questions
Exam 15: Index Numbers129 Questions
Exam 16: Time Series and Forecasting129 Questions
Exam 17: Nonparametric Methods: Goodness-Of-Fit Tests129 Questions
Exam 18: Nonparametric Methods: Analysis of Ranked Data129 Questions
Exam 19: Statistical Process Control and Quality Management129 Questions
Exam 20: An Introduction to Decision Theory115 Questions
Select questions type
Refer to the following wage breakdown for a garment factory. 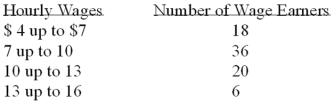 What are the class limits for the class with the smallest frequency?
(Multiple Choice)
4.8/5  (33)
(33)
A ______ chart is useful for displaying a relative frequency distribution.
(Short Answer)
4.7/5 (35)
To construct a histogram, the class frequencies are plotted on the ________________
(Short Answer)
4.7/5 (39)
A data set has 200 observations. In the data, a quantitative variable's highest value is 1080 and its lowest value is 960. What is the minimum class interval that you would recommend? _____________
(Essay)
4.8/5 (38)
Refer to the following breakdown of responses to a survey of room service in a hotel. 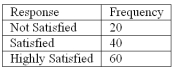 What percent of the responses indicated that customers were satisfied?
(Multiple Choice)
4.8/5 (31)
The monthly salaries of a sample of 100 employees were rounded to the nearest ten dollars. They ranged from a low of $1,040 to a high of $1,720. If we want to condense the data into seven classes, what is the most convenient class interval?
(Multiple Choice)
4.8/5 (36)
Refer to the following breakdown of responses to a survey of room cleanliness in a hotel. 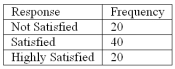 Draw a pie chart that illustrates the relative frequencies.
(Essay)
4.8/5 (28)
When data is collected using a qualitative, nominal variable, i.e., male or female, what is true about a frequency distribution that summarizes the data?
(Multiple Choice)
4.9/5 (36)
A student was interested in the cigarette smoking habits of college students and collected data from an unbiased random sample of students. The data is summarized in the following table: 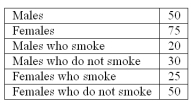 Why is the table NOT a frequency distribution?
(Multiple Choice)
4.8/5 (29)
Refer to the following information from a frequency distribution for "heights of college women" recorded to the nearest inch: The first two class midpoints are 62.5" and 65.5".
What is the class interval?
(Multiple Choice)
4.9/5 (44)
Refer to the following distribution: 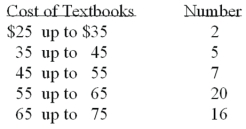 What is the class midpoint for the $45 up to $55 class?
(Multiple Choice)
4.8/5 (33)
In a deck of cards, a class of all cards that are hearts and a class of all cards that are kings are NOT ______________.
(Short Answer)
4.8/5 (38)
Refer to the following breakdown of responses to a survey of "How confident are you that you saved enough to retire"? 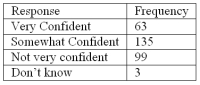 What type of chart should be used to show relative class frequencies?
(Multiple Choice)
4.8/5 (25)
Refer to the following distribution of ages: 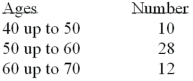 For the distribution of ages above, what is the relative class frequency for the lowest class?
(Multiple Choice)
4.9/5 (34)
The following frequency distribution shows the distribution of delivery times (in days) for swimstuff.com customer orders during the last month. 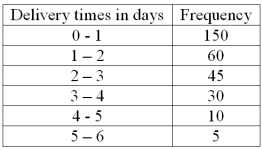 How many orders were delivered in less than three days?
(Short Answer)
4.9/5 (30)
A _____ chart is useful for displaying a frequency distribution for a nominal variable.
(Short Answer)
4.9/5 (38)
Refer to the following class marks or midpoints for a frequency distribution of "weights of college men" recorded to the nearest pound:
The first three class marks are 105, 115, and 125.
What is the lower limit for the third class? _______
(Short Answer)
4.9/5 (30)
The following frequency distribution shows the distribution of delivery times (in days) for swimstuff.com customer orders during the last month. 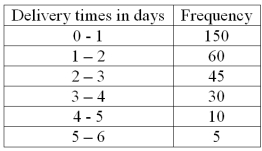 What is the relative frequency for orders delivered in less than one day or 24 hours?
(Short Answer)
5.0/5 (41)
What is the number of observations in each class of a frequency distribution called? _________________________
(Short Answer)
4.9/5 (34)
Filters
- Essay(0)
- Multiple Choice(0)
- Short Answer(0)
- True False(0)
- Matching(0)