Exam 2: Describing Data: Frequency Tables, Frequency Distributions, and Graphic Presentation
Exam 1: What Is Statistics79 Questions
Exam 2: Describing Data: Frequency Tables, Frequency Distributions, and Graphic Presentation129 Questions
Exam 3: Describing Data: Numerical Measures132 Questions
Exam 4: Describing Data: Displaying and Exploring Data108 Questions
Exam 5: A Survey of Probability Concepts130 Questions
Exam 6: Discrete Probability Distributions128 Questions
Exam 7: Continuous Probability Distributions131 Questions
Exam 8: Sampling Methods and the Central Limit Theorem115 Questions
Exam 9: Estimation and Confidence Intervals129 Questions
Exam 10: One-Sample Tests of Hypothesis134 Questions
Exam 11: Two-Sample Tests of Hypothesis130 Questions
Exam 12: Analysis of Variance128 Questions
Exam 13: Correlation and Linear Regression130 Questions
Exam 14: Multiple Regression Analysis129 Questions
Exam 15: Index Numbers129 Questions
Exam 16: Time Series and Forecasting129 Questions
Exam 17: Nonparametric Methods: Goodness-Of-Fit Tests129 Questions
Exam 18: Nonparametric Methods: Analysis of Ranked Data129 Questions
Exam 19: Statistical Process Control and Quality Management129 Questions
Exam 20: An Introduction to Decision Theory115 Questions
Select questions type
When data is collected using a qualitative, nominal variable, what is true about a frequency distribution that summarizes the data?
(Multiple Choice)
4.8/5  (39)
(39)
Refer to the following breakdown of responses to a survey of "How confident are you that you saved enough to retire"? 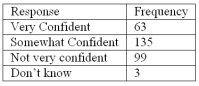 What type of chart should be used to describe the frequency table?
(Multiple Choice)
4.9/5 (41)
In a bar chart, the heights of the bars represent the frequencies in each class.
(True/False)
4.8/5 (31)
The following frequency distribution shows the distribution of delivery times (in days) for swimstuff.com customer orders during the last month. 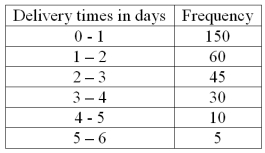 How many orders were delivered in less than one day or 24 hours?
(Short Answer)
5.0/5 (45)
When data is collected using a quantitative, ratio variable, what is true about a frequency distribution that summarizes the data?
(Multiple Choice)
4.8/5 (42)
The age distribution of a sample of part-time employees at Lloyd's Fast Food Emporium is: 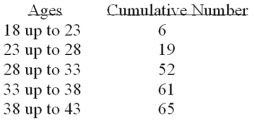 What type of chart should be drawn to present this data?
(Multiple Choice)
4.9/5 (35)
Refer to the following ages (rounded to the nearest whole year) of employees at a large company that were grouped into a distribution with class limits:
20 up to 30
30 up to 40
40 up to 50
50 up to 60
60 up to 70
The class limits for the class 50 up to 60 are _______ and _______.
(Short Answer)
4.8/5 (29)
To summarize the gender of students attending a college, the number of classes in a frequency distribution depends on the number of students.
(True/False)
4.8/5 (42)
The following frequency distribution shows the distribution of delivery times (in days) for swimstuff.com customer orders during the last month. 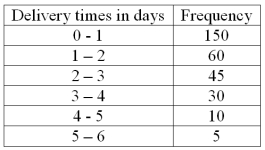 How many orders were delivered in three days or more?
(Short Answer)
4.9/5 (37)
A table showing the number of observations that have been grouped into each of several classes is called a frequency __________________.
(Short Answer)
4.9/5 (38)
Refer to the following ages (rounded to the nearest whole year) of employees at a large company that were grouped into a distribution with class limits:
20 up to 30
30 up to 40
40 up to 50
50 up to 60
60 up to 70
What is the midpoint for the class 40 up to 50? ________
(Short Answer)
4.8/5 (37)
The following frequency distribution shows the distribution of delivery times (in days) for swimstuff.com customer orders during the last month. 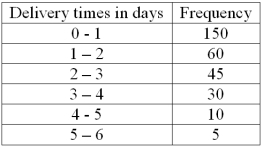 What is the relative frequency of the orders delivered from 1 day up to 3 days?
(Short Answer)
4.9/5 (33)
A student was studying the political party preferences of a university's student population. The survey instrument asked students to identify themselves as a democrat or a republican. This question is flawed because:
(Multiple Choice)
4.7/5 (31)
The following frequency distribution shows the distribution of delivery times (in days) for swimstuff.com customer orders during the last month. 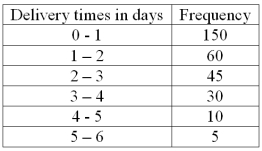 What is the relative frequency for orders delivered in less than three days?
(Short Answer)
4.9/5 (33)
Refer to the following distribution of ages: 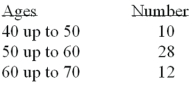 What is the class interval?
(Multiple Choice)
4.8/5 (37)
A group of 100 students was surveyed about their interest in a new International Studies program. Interest was measured in terms of high, medium, or low. 30 students responded high interest; 40 students responded medium interest; 30 students responded low interest. What is the relative frequency of students with high interest?
(Multiple Choice)
4.8/5 (35)
Refer to the following breakdown of responses to a survey of room service in a hotel. 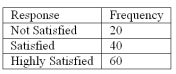 What type of chart should be used to describe the frequency table?
(Multiple Choice)
4.8/5 (31)
A _____ chart is useful for displaying a frequency distribution for a qualitative variable.
(Short Answer)
4.8/5 (33)
Filters
- Essay(0)
- Multiple Choice(0)
- Short Answer(0)
- True False(0)
- Matching(0)