Exam 4: Numerical Descriptive Techniques
Exam 1: What Is Statistics46 Questions
Exam 2: Graphical Descriptive Techniques 194 Questions
Exam 3: Graphical Descriptive Techniques 2156 Questions
Exam 4: Numerical Descriptive Techniques275 Questions
Exam 5: Data Collection and Sampling84 Questions
Exam 6: Probability240 Questions
Exam 7: Random Variables and Discrete Probability Distributions283 Questions
Exam 8: Continuous Probability Distributions224 Questions
Exam 9: Sampling Distributions156 Questions
Exam 10: Introduction to Estimation154 Questions
Exam 11: Introduction to Hypothesis Testing189 Questions
Exam 12: Inference About a Population153 Questions
Exam 13: Inference About Comparing Two Populations170 Questions
Exam 14: Analysis of Variance157 Questions
Exam 15: Chi-Squared Tests179 Questions
Exam 16: Simple Linear Regression and Correlation304 Questions
Exam 17: Multiple Regression160 Questions
Exam 18: Model Building148 Questions
Exam 19: Nonparametric Statistics175 Questions
Exam 20: Time-Series Analytics and Forecasting225 Questions
Exam 21: Statistical Process Control140 Questions
Exam 22: Decision Analysis123 Questions
Exam 23: Conclusion47 Questions
Select questions type
Test Scores Suppose that an analysis of a set of test scores reveals that: Q1 = 45,Q2 = 85,Q3 = 105.
-{Test Scores Narrative} What do these statistics tell you about the shape of the distribution of test scores?
(Essay)
4.9/5  (31)
(31)
Any points that lie outside the whiskers on a box plot are called ____________________.
(Short Answer)
4.8/5 (29)
In a histogram,the proportion of the total area which must be to the left of the median is:
(Multiple Choice)
4.8/5 (32)
The length of the box in a box plot portrays the interquartile range.
(True/False)
4.9/5 (34)
The 5-number summary consists of the smallest observation,the first quartile,the median,the third quartile,and the largest observation.
(True/False)
4.9/5 (40)
The first and second quartiles of a data set can never be equal.
(True/False)
4.9/5 (32)
Generally speaking,if two variables are unrelated,the covariance will be a number close to zero.
(True/False)
4.8/5 (31)
Longevity and Salary A sample of eight observations of variables x (years of experience)and y (salary in $1,000s)is shown below: 
-{Longevity and Salary Narrative}
a.Calculate and interpret the covariance between x and y.
b.Give a possible reason that the covariance is negative.
-{Longevity and Salary Narrative}
a.Calculate and interpret the covariance between x and y.
b.Give a possible reason that the covariance is negative.
(Essay)
4.9/5 (31)
What statistics and graphs can you use to answer the following question: Where is the approximate center of the distribution?
(Essay)
4.9/5 (40)
Which of the following are measures of the linear relationship between two variables?
(Multiple Choice)
4.7/5 (37)
In a bell shaped distribution,there is no difference in the values of the mean,median,and mode.
(True/False)
4.8/5 (38)
In a perfectly symmetric bell shaped "normal" distribution:
(Multiple Choice)
4.9/5 (35)
Weights of Teachers
The following data represent the weights in pounds of a sample of 25 teachers: 164,148,137,157, 173,156,177,172,169,165,145,168,163,162,174,152,156,168,154,151,174,146,134,140, and 171.
-{Weights of Teachers Narrative} Compute the range and coefficient of variation.
(Short Answer)
5.0/5 (31)
Salaries of Office Workers The following data represent the salaries (in thousands of dollars)of a sample of 13 office workers of a firm: 26.5,23.5,29.7,24.8,21.1,24.3,20.4,22.7,27.2,23.7,24.1,24.8,and 28.2.
-{Salaries of Office Workers Narrative} Compute the range.
(Short Answer)
4.9/5 (31)
Ages of Jockeys The following data represent the ages in years of a sample of 25 jockeys from a local race track: 31,43,56,23,49,42,33,61,44,28,48,38,44,35,40,64,52,42,47,39,53,27,36,35,and 20.
-{Ages of Jockeys Narrative}
a.Construct a relative frequency histogram for the data.
b.What does the histogram tell you about the distribution of the data?
(Essay)
4.8/5 (20)
The ____________________ mean of n returns (or growth rates)is the appropriate mean to calculate if you wish to estimate the mean rate of return (or growth rate)for any single period in the future.
(Short Answer)
4.7/5 (34)
Ages of Senior Citizens A sociologist recently conducted a survey of citizens over 65 years of age whose net worth is too high to qualify for Medicaid and who have no private health insurance.The ages of 22 uninsured senior citizens were as follows: 65,66,67,68,69,70,71,73,74,75,76,77,78,79,80,81,86,87,91,92, 94,and 97.
-{Ages of Senior Citizens Narrative} Calculate the mean age of the uninsured senior citizens
(Essay)
4.9/5 (44)
Ages of Workers The ages (in years)of three groups of workers are shown below: 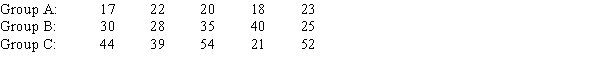
-{Ages of Workers Narrative} Compute and compare the coefficient of variation for the three samples.
-{Ages of Workers Narrative} Compute and compare the coefficient of variation for the three samples.
(Essay)
4.7/5 (38)
The ____________________ mean is used whenever we wish to find the "average" growth rate,or rate of change,in a variable over time.
(Short Answer)
4.7/5 (34)
Filters
- Essay(0)
- Multiple Choice(0)
- Short Answer(0)
- True False(0)
- Matching(0)