Exam 4: Numerical Descriptive Techniques
Exam 1: What Is Statistics46 Questions
Exam 2: Graphical Descriptive Techniques 194 Questions
Exam 3: Graphical Descriptive Techniques 2156 Questions
Exam 4: Numerical Descriptive Techniques275 Questions
Exam 5: Data Collection and Sampling84 Questions
Exam 6: Probability240 Questions
Exam 7: Random Variables and Discrete Probability Distributions283 Questions
Exam 8: Continuous Probability Distributions224 Questions
Exam 9: Sampling Distributions156 Questions
Exam 10: Introduction to Estimation154 Questions
Exam 11: Introduction to Hypothesis Testing189 Questions
Exam 12: Inference About a Population153 Questions
Exam 13: Inference About Comparing Two Populations170 Questions
Exam 14: Analysis of Variance157 Questions
Exam 15: Chi-Squared Tests179 Questions
Exam 16: Simple Linear Regression and Correlation304 Questions
Exam 17: Multiple Regression160 Questions
Exam 18: Model Building148 Questions
Exam 19: Nonparametric Statistics175 Questions
Exam 20: Time-Series Analytics and Forecasting225 Questions
Exam 21: Statistical Process Control140 Questions
Exam 22: Decision Analysis123 Questions
Exam 23: Conclusion47 Questions
Select questions type
Ages of Workers The ages (in years)of three groups of workers are shown below: 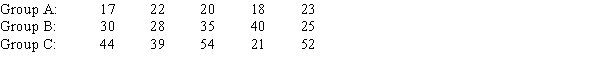
-{Ages of Workers Narrative} Calculate and compare the standard deviations for the three samples.
-{Ages of Workers Narrative} Calculate and compare the standard deviations for the three samples.
(Essay)
4.8/5  (31)
(31)
Hours Worked per Week The following data represent the hours worked per week of a sample of 25 employees from a government department: 31,43,56,23,49,42,33,61,44,28,48,38,44,35,40,64,52,42,47,39,53, 27,36,35,and 20.
-{Hours Worked per Week Narrative} Construct a stem and leaf display for the hours.
(Essay)
4.7/5 (33)
While Chebysheff's Theorem applies to any distribution,regardless of shape,the Empirical Rule applies only to distributions that are bell shaped.
(True/False)
4.9/5 (34)
Ages of Retirees A sociologist recently conducted a survey of retirees over 65 years of age whose net worth is too high to qualify for Medicaid and who have no private health insurance.The ages of 20 uninsured retirees were as follows: 65,66,67,68,69,70,71,73,74,75,78,79,80,81,86,87,91,92,94,and 97.
-{Ages of Retirees Narrative} What does the value of the third quartile tell you?
(Essay)
4.9/5 (33)
Weights of Police Officers
The following data represent the weights in pounds of a sample of 25 police officers: 164,148,137, 157,173,156,177,172,169,165,145,168,163,162,174,152,156,168,154,151,174,146,134, 140,and 171.
-{Weights of Police Officers Narrative}
a.Construct a box plot for the weights.
b.Are there any extreme values?
c.What does the box plot tell you about the distribution of the data?
(Essay)
4.7/5 (29)
The data set 10,20,30 has the same variance as the data set 100,200,300.
(True/False)
4.8/5 (34)
Test Scores Suppose that an analysis of a set of test scores reveals that: Q1 = 45,Q2 = 85,Q3 = 105.
-{Test Scores Narrative} Calculate the interquartile range.What does this tell you about the data?
(Essay)
4.8/5 (32)
{Weights of Workers Narrative} Is the distribution of the number of workers symmetric or skewed? Why?
(Essay)
4.8/5 (25)
The range,variance,standard deviation,and coefficient of variation are to be used only on ____________________ data.
(Short Answer)
4.7/5 (37)
Milk Demand A supermarket has determined that daily demand for milk containers has an approximate bell shaped distribution,with a mean of 55 containers and a standard deviation of six containers.
-{Milk Demand Narrative} What percentage of the time will the number of containers of milk sold be more than 2 standard deviations from the mean?
(Short Answer)
4.9/5 (33)
Chebysheff's Theorem states that the percentage of measurements in a data set that fall within three standard deviations of their mean is:
(Multiple Choice)
4.9/5 (38)
Strip Mall Rent Monthly rent data in dollars for a sample of 10 stores in a small town in South Dakota are as follows: 220,216,220,205,210,240,195,235,204,and 250.
-{Strip Mall Rent Narrative} Compute the sample median.
(Short Answer)
4.8/5 (41)
Is a standard deviation of 10 a large number indicating great variability,or is it small number indicating little variability? To answer this question correctly,one should look carefully at the value of the:
(Multiple Choice)
4.9/5 (27)
The ____________________ is calculated by finding the middle of the data set,when the data are ordered from smallest to largest.
(Short Answer)
4.9/5 (33)
Consider the following population of measurements: 162,152,177,157,184,176,165,181,170,and 163.Label and compute the variance and standard deviation.
(Essay)
4.9/5 (37)
Lily has been keeping track of what she spends to eat out.The last week's expenditures for meals eaten out were $5.69,$5.95,$6.19,$10.91,$7.49,$14.53,and $7.66.The mean amount Lily spends on meals is $8.35.
(True/False)
4.8/5 (39)
If the covariance of x and y is 26.16 and the standard deviation of x is 32.7,then the slope of the least squares line is b1 =.80.
(True/False)
4.8/5 (38)
Generally speaking,if two variables are unrelated (as one increases,the other shows no pattern),the covariance will be:
(Multiple Choice)
4.9/5 (31)
Filters
- Essay(0)
- Multiple Choice(0)
- Short Answer(0)
- True False(0)
- Matching(0)