Exam 15: Chi-Squared Tests
Exam 1: What Is Statistics46 Questions
Exam 2: Graphical Descriptive Techniques 194 Questions
Exam 3: Graphical Descriptive Techniques 2156 Questions
Exam 4: Numerical Descriptive Techniques275 Questions
Exam 5: Data Collection and Sampling84 Questions
Exam 6: Probability240 Questions
Exam 7: Random Variables and Discrete Probability Distributions283 Questions
Exam 8: Continuous Probability Distributions224 Questions
Exam 9: Sampling Distributions156 Questions
Exam 10: Introduction to Estimation154 Questions
Exam 11: Introduction to Hypothesis Testing189 Questions
Exam 12: Inference About a Population153 Questions
Exam 13: Inference About Comparing Two Populations170 Questions
Exam 14: Analysis of Variance157 Questions
Exam 15: Chi-Squared Tests179 Questions
Exam 16: Simple Linear Regression and Correlation304 Questions
Exam 17: Multiple Regression160 Questions
Exam 18: Model Building148 Questions
Exam 19: Nonparametric Statistics175 Questions
Exam 20: Time-Series Analytics and Forecasting225 Questions
Exam 21: Statistical Process Control140 Questions
Exam 22: Decision Analysis123 Questions
Exam 23: Conclusion47 Questions
Select questions type
We can use the goodness-of-fit test to determine whether data were drawn from any distribution of interest.The most common application of this procedure is a test of ____________________.
(Short Answer)
4.9/5  (37)
(37)
The squared difference between the observed and expected frequencies should be large if there is a significant difference between the proportions.
(True/False)
4.9/5 (37)
Suppose that a random sample of 60 observations was drawn from a population.After calculating the mean and standard deviation,each observation was standardized and the number of observations in each of the intervals below was counted.Can we infer at the 10% significance level that the data were drawn from a normal population? 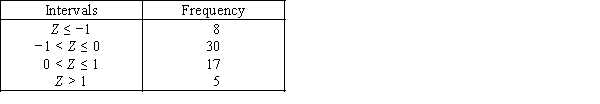
(Essay)
4.8/5 (35)
To test for normality,the ____________________ hypothesis is that at least two proportions differ from their specified values.
(Short Answer)
5.0/5 (36)
A test for whether one proportion is higher than the other can be performed using the chi-squared distribution.
(True/False)
4.9/5 (46)
If we want to test for differences between two populations of nominal data with exactly two categories,we can employ either the z-test of p1 − p2,or the chi-squared test of a contingency table.
(True/False)
4.9/5 (33)
In a test of a contingency table,rejecting the null hypothesis concludes the variables are not independent.
(True/False)
4.9/5 (41)
Seat Belts
A study was conducted to determine whether the use of seat belts in vehicles depends on whether or not a child was present in the car.A sample of 1,000 people treated for injuries sustained from vehicle accidents was obtained,and each person was classified according to (1)child present (yes/no)and (2)seat belt usage (worn or not worn)during the accident.The data are shown in the table below. 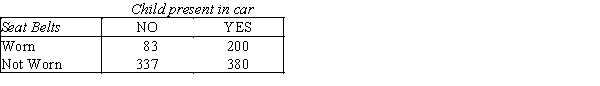
-{Seat Belts Narrative} Which test would be used to properly analyze the data in this experiment?
-{Seat Belts Narrative} Which test would be used to properly analyze the data in this experiment?
(Short Answer)
5.0/5 (35)
If we want to conduct a two-tail test of a population proportion,we can employ:
(Multiple Choice)
4.8/5 (36)
A small chi-squared test statistic in a goodness-of-fit test supports the null hypothesis.
(True/False)
4.8/5 (43)
Consider a multinomial experiment involving 160 trials 4 categories (cells).The observed frequencies resulting from the experiment are shown in the accompanying table.  Use the 10% significance level to test the hypotheses: H0: p1 = p2 = p3 = p4 = .25 vs.H1: At least one proportion differs from their specified values.
(Essay)
4.9/5 (43)
Which of the following tests is used to analyze nominal data?
(Multiple Choice)
4.8/5 (37)
Which of the following statements is true for chi-squared tests?
(Multiple Choice)
4.8/5 (37)
In a goodness-of-fit test,all of the proportions specified in the null hypothesis must be equal to each other.
(True/False)
4.9/5 (40)
The number of degrees of freedom in a chi-squared test for normality,where the number of standardized intervals is 5 and there are 2 population parameters to be estimated from the data,is equal to:
(Multiple Choice)
4.9/5 (34)
Student Absenteeism
Consider a multinomial experiment involving n = 200 students of a large high school.The attendance department recorded the number of students who were absent during the weekdays.The null hypothesis to be tested is: H0: p1 = .10,p2 = .25,p3 = .30,p4 = .20,p5 = .15.
-{Student Absenteeism Narrative} Test the hypothesis at the 5% level of significance with the following frequencies: 
(Essay)
4.9/5 (47)
Which of the following tests is appropriate for nominal data if the problem objective is to describe a population with more than two categories?
(Multiple Choice)
4.9/5 (37)
Which of the following represents H1 in a chi-squared goodness-of-fit test to see if all 5 colors of a certain candy appear in the same proportion in the population?
(Multiple Choice)
5.0/5 (36)
The test statistic for the chi-squared test of a contingency table is the same as the test statistic for the goodness-of-fit test.
(True/False)
4.9/5 (37)
A large chi-squared test statistic in a test of a contingency table means you conclude:
(Multiple Choice)
4.8/5 (37)
Filters
- Essay(0)
- Multiple Choice(0)
- Short Answer(0)
- True False(0)
- Matching(0)