Exam 16: Simple Linear Regression and Correlation
Exam 1: What Is Statistics46 Questions
Exam 2: Graphical Descriptive Techniques 194 Questions
Exam 3: Graphical Descriptive Techniques 2156 Questions
Exam 4: Numerical Descriptive Techniques275 Questions
Exam 5: Data Collection and Sampling84 Questions
Exam 6: Probability240 Questions
Exam 7: Random Variables and Discrete Probability Distributions283 Questions
Exam 8: Continuous Probability Distributions224 Questions
Exam 9: Sampling Distributions156 Questions
Exam 10: Introduction to Estimation154 Questions
Exam 11: Introduction to Hypothesis Testing189 Questions
Exam 12: Inference About a Population153 Questions
Exam 13: Inference About Comparing Two Populations170 Questions
Exam 14: Analysis of Variance157 Questions
Exam 15: Chi-Squared Tests179 Questions
Exam 16: Simple Linear Regression and Correlation304 Questions
Exam 17: Multiple Regression160 Questions
Exam 18: Model Building148 Questions
Exam 19: Nonparametric Statistics175 Questions
Exam 20: Time-Series Analytics and Forecasting225 Questions
Exam 21: Statistical Process Control140 Questions
Exam 22: Decision Analysis123 Questions
Exam 23: Conclusion47 Questions
Select questions type
Accidents and Rain
A statistician investigating the relationship between the amount of rain (in inches)and the number of automobile accidents gathered data on accidents in her city for 10 randomly selected days throughout the year.The results are shown below. 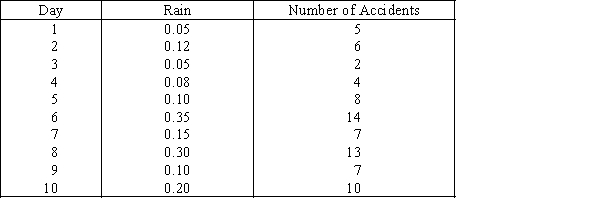
-{Accidents and Rain Narrative} What other variables might be associated with accidents,besides or along with rain?
-{Accidents and Rain Narrative} What other variables might be associated with accidents,besides or along with rain?
(Essay)
4.8/5  (35)
(35)
Sunshine and Melanoma
A medical researcher wanted to examine the relationship between the amount of sunshine (x)in hours,and incidence of melanoma,a type of skin cancer (y).As an experiment he found the number of melanoma cases detected per 100,000 of population and the average daily sunshine in eight counties around the country.These data are shown below. 
-{Sunshine and Melanoma Narrative} Calculate the residual corresponding to the pair (x,y)= (8,15).
-{Sunshine and Melanoma Narrative} Calculate the residual corresponding to the pair (x,y)= (8,15).
(Essay)
4.9/5 (31)
If the coefficient of determination is 1.0,then the coefficient of correlation must be 1.0.
(True/False)
4.9/5 (29)
A regression analysis between sales (in $1000)and advertising (in $100)resulted in the following least squares line:  .This implies that if advertising is $600,then the predicted amount of sales (in dollars)is $125,000.
(True/False)
4.8/5 (32)
Sales and Experience
The general manager of a chain of department stores believes that experience is the most important factor in determining the level of success of a salesperson. To examine this belief she records last month's sales (in $1,000s) and the years of experience of 10 randomly selected salespeople. These data are listed below.
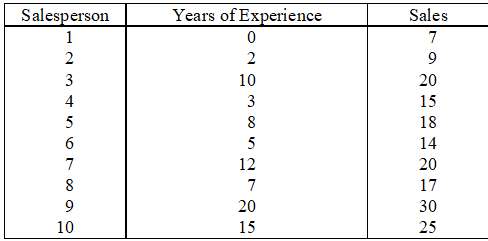 -{Sales and Experience Narrative} Conduct a test of the population coefficient of correlation to determine at the 5% significance level whether more experience is related to higher sales,as the manager speculates.
(Essay)
4.9/5 (31)
If the value of the sum of squares for error SSE equals zero,then the coefficient of determination must equal zero.
(True/False)
4.8/5 (35)
Cost of Textbooks
The editor of a higher education book publisher claims that a large part of the cost of books is the cost of paper. This implies that larger textbooks will cost more money. As an experiment to analyze the claim, a university student visits the bookstore and records the number of pages and the selling price of twelve randomly selected textbooks. These data are listed below
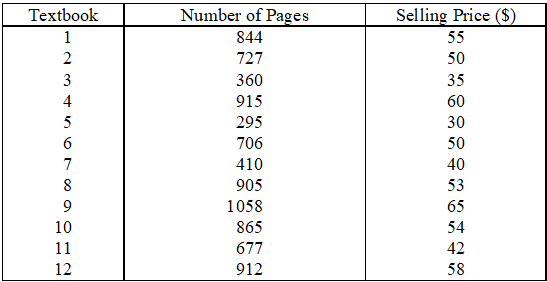 -{Cost of Books Narrative} Predict with 90% confidence the selling price of a book with 900 pages.
(Essay)
4.8/5 (45)
The coefficient of ____________________ measures the amount of variation in the dependent variable that is explained by the variation in the independent variable.
(Essay)
4.8/5 (40)
Trivia Games & Education
An ardent fan of television game shows has observed that,in general,the more educated the contestant,the less money he or she wins.To test her belief she gathers data about the last eight winners of her favorite game show.She records their winnings in dollars and the number of years of education.The results are as follows. 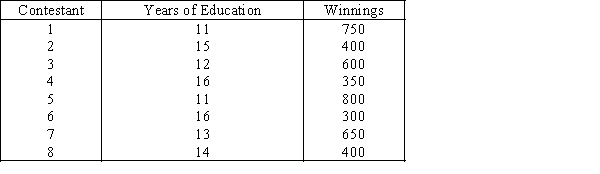
-{Trivia Games & Education Narrative} Draw a scatter diagram of the data.Comment on whether it appears that a linear model might be appropriate.
-{Trivia Games & Education Narrative} Draw a scatter diagram of the data.Comment on whether it appears that a linear model might be appropriate.
(Essay)
4.8/5 (32)
Marc Anthony Concert
At a recent Marc Anthony concert,a survey was conducted that asked a random sample of 20 people their age and how many concerts they have attended since the first of the year.The following data were collected:  An Excel output follows:
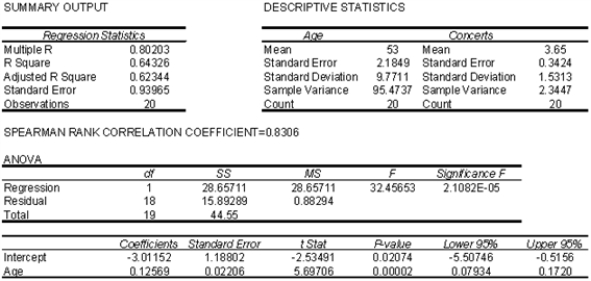
-{Marc Anthony Concert Narrative} Use the predicted values and the actual values of y to calculate the residuals.
-{Marc Anthony Concert Narrative} Use the predicted values and the actual values of y to calculate the residuals.
(Essay)
4.9/5 (34)
The spread in the residuals should increase as the predicted value of y increases.
(True/False)
4.8/5 (32)
Speed vs Gas Mileage
An economist wanted to analyze the relationship between the speed of a car (x)and its gas mileage (y).As an experiment a car is operated at several different speeds and for each speed the gas mileage is measured.These data are shown below. 
-{Car Speed and Gas Mileage Narrative} Determine the least squares regression line.
-{Car Speed and Gas Mileage Narrative} Determine the least squares regression line.
(Essay)
4.8/5 (28)
In the simple linear regression model,the slope represents the:
(Multiple Choice)
4.8/5 (31)
Allman Brothers Concert
At a recent Allman Brothers concert,a survey was conducted that asked a random sample of 20 people their age and how many concerts they have attended since the first of the year.The following data were collected: 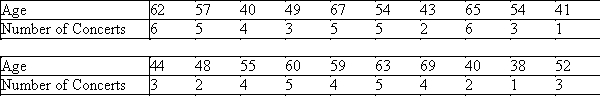 An Excel output follows:
 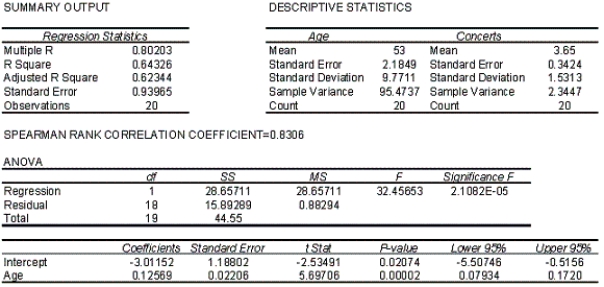 -{Allman Brothers Concert Narrative} Draw a scatter diagram of the data.Comment on whether it appears that a linear model might be appropriate to describe the relationship between the age and number of concerts attended by the respondents.
(Essay)
4.9/5 (26)
A prediction interval for a particular y is always ____________________ than a confidence interval for the mean of y.
(Short Answer)
4.9/5 (27)
Rock Concert Revenues
A financier whose specialty is investing in rock concerts has observed that,in general,concerts with "big-name" stars seem to generate more revenue than those concerts whose stars are less well known.To examine his belief he records the gross revenue and the payment (in $ millions)given to the two highest-paid performers in the concert for ten concert tours. 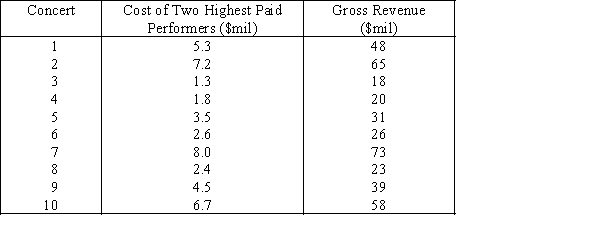
-{Rock Concert Revenues Narrative} Calculate the Pearson correlation coefficient.Interpret the results.
-{Rock Concert Revenues Narrative} Calculate the Pearson correlation coefficient.Interpret the results.
(Essay)
4.8/5 (26)
We standardize residuals by subtracting their mean and dividing by their variance.
(True/False)
4.9/5 (35)
In testing the hypotheses: H0: β1 = 0 vs.H0: β1 ≠ 0,the following statistics are available:  The value of the test statistic is:
(Multiple Choice)
4.8/5 (29)
Income and Education
A professor of economics wants to study the relationship between income (y in $1000s)and education (x in years).A random sample eight individuals is taken and the results are shown below. 
-{Income and Education Narrative} Determine the least squares regression line.
-{Income and Education Narrative} Determine the least squares regression line.
(Essay)
4.9/5 (35)
Filters
- Essay(0)
- Multiple Choice(0)
- Short Answer(0)
- True False(0)
- Matching(0)