Exam 2: Graphs,charts and Tablesdescribing Your Data
Exam 1: The Where, why, and How of Data Collection167 Questions
Exam 2: Graphs,charts and Tablesdescribing Your Data138 Questions
Exam 3: Describing Data Using Numerical Measures130 Questions
Exam 4: Using Probability and Probability Distributions77 Questions
Exam 5: Discrete Probability Distributions119 Questions
Exam 6: Introduction to Continuous Probability Distributions90 Questions
Exam 7: Introduction to Sampling Distributions104 Questions
Exam 8: Estimating Single Population Parameters145 Questions
Exam 9: Introduction to Hypothesis Testing129 Questions
Exam 10: Estimation and Hypothesis Testing for Two Population Parameters97 Questions
Exam 11: Hypothesis Tests and Estimation for Population Variances71 Questions
Exam 12: Analysis of Variance137 Questions
Exam 13: Goodness-Of-Fit Tests and Contingency Analysis104 Questions
Exam 14: Introduction to Linear Regression and Correlation Analysis136 Questions
Exam 15: Multiple Regression Analysis and Model Building153 Questions
Exam 16: Analyzing and Forecasting Time-Series Data133 Questions
Exam 17: Introduction to Nonparametric Statistics104 Questions
Exam 18: Introduction to Quality and Statistical Process Control110 Questions
Exam 19: Introduction to Decision Analysis116 Questions
Select questions type
Which of the following can NOT be shown effectively with a histogram?
(Multiple Choice)
4.8/5  (40)
(40)
A scatter diagram can show that the relationship between two variables is actually nonlinear.
(True/False)
4.8/5 (36)
A scatter diagram can show whether a pair of variables has a strong or weak relation,and also whether it is linear or curved.
(True/False)
4.8/5 (38)
Consider the following chart.Which of the following statements is most correct? 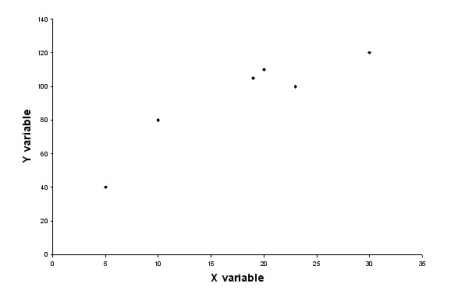
(Multiple Choice)
4.8/5 (40)
In analyzing a single quantitative variable,you will generally choose to use a scatter diagram if the variable is measured over time and a histogram if the variable is cross-sectional.
(True/False)
4.7/5 (41)
A common rule of thumb for determining how many classes to use when developing a frequency distribution with classes is:
(Multiple Choice)
4.7/5 (39)
A study was recently done in which the brand preference for breakfast cereal was analyzed against the gender of the shopper.The study consisted of 200 male shoppers and 300 female shoppers.Three different cereal brands were considered: A,B,and C.A total of 250 female shoppers preferred brand A,25 female shoppers preferred brand C.A total of 100 shoppers preferred brand B.The number of male shoppers that preferred brand B was:
(Multiple Choice)
4.8/5 (43)
Explain why a relative frequency histogram is sometimes preferable to a regular frequency histogram.
(Essay)
4.8/5 (36)
When a histogram is constructed for discrete numerical data,there should be spaces between the bars of the histogram.
(True/False)
4.8/5 (38)
When using the Histogram tool in Excel to construct a frequency distribution and histogram,the bins represent the upper class limits.
(True/False)
4.8/5 (42)
In constructing a frequency distribution for the savings account balances for customers at a bank,the following class boundaries might be acceptable if the minimum balance is $5.00 and the maximum balance is $18,700: 
(True/False)
4.8/5 (40)
Suppose that you have a data set of 120 observations and the data values range from 36 to 187.What classes would you choose for this data set? Explain why you would choose these values.
(Essay)
4.9/5 (38)
A major insurance company believes that for drivers between 16 years of age and 60 years of age,the number of accidents per year tends to decrease as age increases.If this is the case,a scatter diagram should show a negative relationship between the two variables.
(True/False)
4.8/5 (43)
A histogram is used to display which of the following characteristics for a quantitative variable?
(Multiple Choice)
4.9/5 (32)
A scatter diagram is a line graph without the points connected by a line.
(True/False)
4.9/5 (35)
In a study involving car owners,one question asked the owner for the number of miles driven last year.A second question asked the owner for the age of the vehicle.A joint frequency distribution would be useful for determining whether newer cars tend to be driven more miles than older cars.
(True/False)
4.9/5 (42)
Filters
- Essay(0)
- Multiple Choice(0)
- Short Answer(0)
- True False(0)
- Matching(0)