Exam 19: Statistical Process Control and Quality Management
Exam 1: What Is Statistics83 Questions
Exam 2: Describing Data: Frequency Tables, Frequency Distributions, and Graphic Presentation132 Questions
Exam 3: Describing Data: Numerical Measures124 Questions
Exam 4: Describing Data: Displaying and Exploring Data113 Questions
Exam 5: A Survey of Probability Concepts134 Questions
Exam 6: Discrete Probability Distributions131 Questions
Exam 7: Continuous Probability Distributions135 Questions
Exam 8: Sampling Methods and the Central Limit Theorem117 Questions
Exam 9: Estimation and Confidence Intervals131 Questions
Exam 10: One-Sample Tests of Hypothesis110 Questions
Exam 11: Two-Sample Tests of Hypothesis98 Questions
Exam 12: Analysis of Variance134 Questions
Exam 13: Correlation and Linear Regression138 Questions
Exam 14: Multiple Regression Analysis135 Questions
Exam 15: Nonparametric Methods: Nominal Level Hypothesis Tests181 Questions
Exam 16: Nonparametric Methods: Analysis of Ordinal Data138 Questions
Exam 17: Index Numbers137 Questions
Exam 18: Time Series and Forecasting139 Questions
Exam 19: Statistical Process Control and Quality Management136 Questions
Exam 20: An Introduction to Decision Theory115 Questions
Select questions type
Over the last ten days, a manufacturer of cell phones counts the number of defective phones created in each eight-hour shift. The results are shown next. 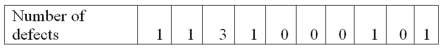 To construct a process control chart for the mean number defective, what is the upper control limit?
(Essay)
4.9/5  (36)
(36)
A new machine used in the production of motor mount bolts was put into operation. Five samples of size 100 were randomly selected and the number of defectives in each sample was noted. 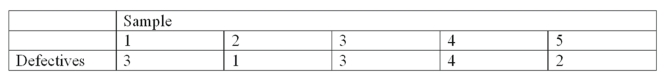 What is the upper control limit (UCL)?
(Multiple Choice)
4.8/5 (38)
A major distributor buys shoes from a supplier. The distributor randomly samples the shoes to inspect for quality. The distributor's specifications state that a delivery of 100 pairs of shoes will be accepted only if the number of defective pairs of shoes in a sample of 10 pairs is two or less. Based on the sampling plan, what is the probability of accepting the delivery of 100 pairs of shoes if the actual percent defective is 0.05?
(Essay)
4.8/5 (35)
Random samples of four items are selected from a manufacturing process at regular intervals and a certain quality characteristic is measured. After 25 samples, ΣX = 15,350 and ΣR = 411.4. To construct a mean chart, what is the upper control limit (UCL) for the mean?
(Multiple Choice)
4.8/5 (38)
In acceptance sampling, it is possible that an incoming lot of computer chips contains more defective chips than it should, but it is still accepted. In acceptance sampling, this probability is called _____________.
(Short Answer)
4.8/5 (28)
There are two general types of causes of variations in manufacturing and service processes: chance and assignable causes.
(True/False)
4.7/5 (32)
A new machine is set or calibrated to fill tubes of toothpaste at precisely 6.75 ounces. Then, once the machine is running, a sample of six tubes is taken every three hours and weighed with the following results: 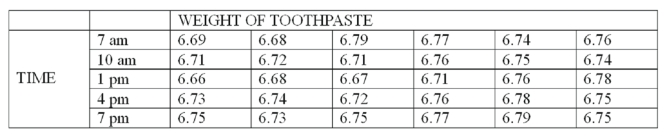 What is the value of the upper control factor of the range?
(Multiple Choice)
5.0/5 (32)
The Quality Assurance Department selected 12 samples of 100 printed circuit boards and tested them. The number of defective printed circuit boards in each sample was 3, 3, 0, 5, 1, 1, 5, 6, 6, 2, 0, and 1. The measurement of quality is based on:
(Multiple Choice)
4.8/5 (30)
A new printing machine is set or calibrated to print 25 copies per minute. On each of four days, the printer's output is measured five times. The data will be used to construct a process control chart to monitor the printing process. The results of the printing process are in the following table. 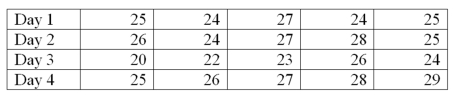 What is the value of the upper control limit factor for a range chart?
(Essay)
4.9/5 (33)
A manufacturer of golf club shafts inspects 50 shafts every day. Over the last ten days, the number of defective shafts has been reported to be the following. 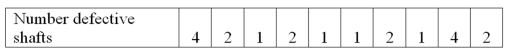 What is the standard error of the mean proportion of defective shafts?
(Essay)
4.9/5 (37)
Random samples of four items are selected from a manufacturing process at regular intervals and a certain quality characteristic is measured. After 25 samples, ΣX = 15,350 and ΣR = 411.4. To construct a range chart, what is the lower control limit (LCL) for the range?
(Multiple Choice)
4.9/5 (39)
Control charts can be developed for both variables and attributes.
(True/False)
4.9/5 (27)
The Quality Assurance Department selected a sample of 12 printed circuit boards and tested them. The number of defects in each circuit board was 3, 3, 0, 5, 1, 1, 5, 6, 6, 2, 0, and 1. What kind of control chart should be constructed to monitor the process?
(Multiple Choice)
4.9/5 (43)
One of the most important concepts of statistical process control is that no two products are ________________.
(Short Answer)
4.7/5 (30)
The purpose of a statistical control chart that plots sample means is to __________________________.
(Short Answer)
4.8/5 (39)
What is the purpose of quality control in production and service operations?
(Essay)
4.7/5 (27)
A fishbone diagram classifies potential causes into categories. What are they?
(Multiple Choice)
4.7/5 (29)
Consider a company that wishes to verify that an incoming product meets the stipulated requirements by screening the products using a statistical sampling plan. If the sample inspection reveals that a lot was accepted, yet it had more defects than it should, this is referred to as:
(Multiple Choice)
5.0/5 (36)
Filters
- Essay(0)
- Multiple Choice(0)
- Short Answer(0)
- True False(0)
- Matching(0)