Exam 19: Statistical Process Control and Quality Management
Exam 1: What Is Statistics83 Questions
Exam 2: Describing Data: Frequency Tables, Frequency Distributions, and Graphic Presentation132 Questions
Exam 3: Describing Data: Numerical Measures124 Questions
Exam 4: Describing Data: Displaying and Exploring Data113 Questions
Exam 5: A Survey of Probability Concepts134 Questions
Exam 6: Discrete Probability Distributions131 Questions
Exam 7: Continuous Probability Distributions135 Questions
Exam 8: Sampling Methods and the Central Limit Theorem117 Questions
Exam 9: Estimation and Confidence Intervals131 Questions
Exam 10: One-Sample Tests of Hypothesis110 Questions
Exam 11: Two-Sample Tests of Hypothesis98 Questions
Exam 12: Analysis of Variance134 Questions
Exam 13: Correlation and Linear Regression138 Questions
Exam 14: Multiple Regression Analysis135 Questions
Exam 15: Nonparametric Methods: Nominal Level Hypothesis Tests181 Questions
Exam 16: Nonparametric Methods: Analysis of Ordinal Data138 Questions
Exam 17: Index Numbers137 Questions
Exam 18: Time Series and Forecasting139 Questions
Exam 19: Statistical Process Control and Quality Management136 Questions
Exam 20: An Introduction to Decision Theory115 Questions
Select questions type
Random samples of four items are selected from a manufacturing process at regular intervals and a certain quality characteristic is measured. After 25 samples, ΣX = 15,350 and ΣR = 411.4. To construct a range chart, what is the upper control limit (UCL) for the range?
(Multiple Choice)
4.9/5  (35)
(35)
Equipment failure would be an example of ____________ variation.
(Multiple Choice)
4.9/5 (29)
Random samples of four items are selected from a manufacturing process at regular intervals and a certain quality characteristic is measured. After 25 samples, ΣX = 15,350 and ΣR = 411.4 The measurement of quality is based on:
(Multiple Choice)
4.8/5 (31)
A new printing machine is set or calibrated to print 25 copies per minute. On each of four days, the printer's output is measured five times. The data will be used to construct a process control chart to monitor the printing process. The results of the printing process are in the following table. 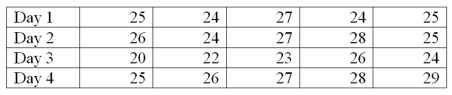 What is the upper control limit (UCL) for the mean chart?
(Essay)
4.8/5 (40)
A c-bar chart shows the percent of the production that is defective.
(True/False)
4.8/5 (36)
A new machine is set or calibrated to fill tubes of toothpaste at precisely 6.75 ounces. Then, once the machine is running, a sample of six tubes is taken every three hours and weighed with the following results: 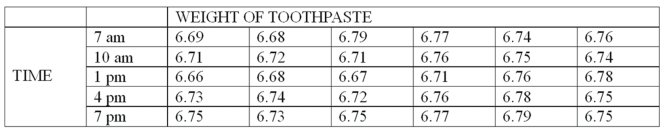 What is the value of the lower control factor of the range?
(Multiple Choice)
5.0/5 (39)
One purpose of quality control is to reduce the costs associated with producing and delivering poor quality goods and services.
(True/False)
4.8/5 (33)
A new printing machine is set or calibrated to print 25 copies per minute. On each of four days, the printer's output is measured five times. The data will be used to construct a process control chart to monitor the printing process. The results of the printing process are in the following table. 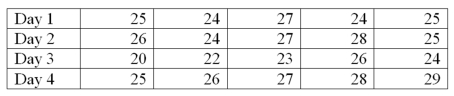 What is the range of the samples on Day 3?
(Essay)
4.9/5 (33)
Which probability distribution is used to develop a control chart for sample means?
(Multiple Choice)
4.8/5 (32)
Cappelli Inc. designs and manufactures women's apparel using material from various mills. Their acceptance sampling plan states that 20 two-inch squares of the incoming material must be carefully checked. If 3 or less squares reveal imperfections, the lot is accepted. What is the probability that an incoming lot from Blufton Mills that contains 40 percent imperfect cloth will be accepted?
(Multiple Choice)
4.9/5 (35)
In acceptance sampling, there is one unique operating characteristic curve for a specified sampling plan.
(True/False)
4.9/5 (39)
What is the process that insures that a company is producing a quality product or service?
(Multiple Choice)
4.8/5 (39)
A chart used to show the results of a Pareto analysis is a:
(Multiple Choice)
4.7/5 (32)
A new machine that fills tubes of toothpaste will be monitored using statistical process control. The following data were collected while the machine was closely monitored and under control. Each day a random sample of six tubes are weighed. Based on the data, the process mean is 6.752. 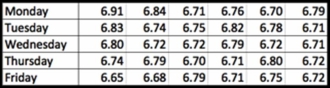 What is the lower control limit for the x-bar chart rounded to three decimal places?
(Multiple Choice)
4.8/5 (47)
The "in control" region of a control chart is called the ____________________.
(Short Answer)
4.9/5 (29)
Filters
- Essay(0)
- Multiple Choice(0)
- Short Answer(0)
- True False(0)
- Matching(0)