Exam 11: Two-Sample Tests of Hypothesis
Exam 1: What Is Statistics83 Questions
Exam 2: Describing Data: Frequency Tables, Frequency Distributions, and Graphic Presentation132 Questions
Exam 3: Describing Data: Numerical Measures124 Questions
Exam 4: Describing Data: Displaying and Exploring Data113 Questions
Exam 5: A Survey of Probability Concepts134 Questions
Exam 6: Discrete Probability Distributions131 Questions
Exam 7: Continuous Probability Distributions135 Questions
Exam 8: Sampling Methods and the Central Limit Theorem117 Questions
Exam 9: Estimation and Confidence Intervals131 Questions
Exam 10: One-Sample Tests of Hypothesis110 Questions
Exam 11: Two-Sample Tests of Hypothesis98 Questions
Exam 12: Analysis of Variance134 Questions
Exam 13: Correlation and Linear Regression138 Questions
Exam 14: Multiple Regression Analysis135 Questions
Exam 15: Nonparametric Methods: Nominal Level Hypothesis Tests181 Questions
Exam 16: Nonparametric Methods: Analysis of Ordinal Data138 Questions
Exam 17: Index Numbers137 Questions
Exam 18: Time Series and Forecasting139 Questions
Exam 19: Statistical Process Control and Quality Management136 Questions
Exam 20: An Introduction to Decision Theory115 Questions
Select questions type
If we are testing for the difference between two population means and assume that the two populations have equal and unknown standard deviations, the standard deviations are ______ to compute a point estimate of the population variance.
(Short Answer)
4.8/5  (33)
(33)
Accounting procedures allow a business to evaluate their inventory costs based on two methods: LIFO (Last In First Out) or FIFO (First In First Out). A manufacturer evaluated its finished goods inventory (in $000s) for five products with the LIFO and FIFO methods. To analyze the difference, they computed (FIFO - LIFO) for each product. Based on the following results, does the LIFO method result in a lower cost of inventory than the FIFO method? 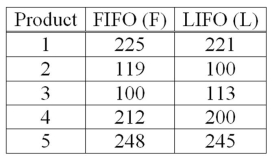 If you use the 5% level of significance, what is the critical t value?
(Multiple Choice)
4.8/5 (36)
Use the following table to determine whether or not there is a significant difference between the average hourly wages at two manufacturing companies. 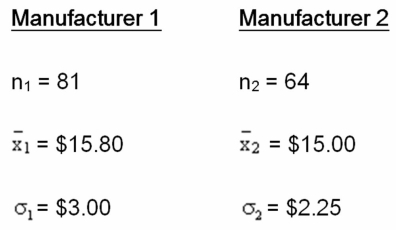 What is the point estimate of the difference between the means?
(Multiple Choice)
4.9/5 (42)
When the standard deviations are equal but unknown, a test for the differences between two population means has n - 1 degrees of freedom.
(True/False)
4.8/5 (38)
A financial planner wants to compare the yield of income and growth mutual funds. Fifty thousand dollars is invested in each of a sample of 35 income and 40 growth funds. The mean increase for a two-year period for the income funds is $900. For the growth funds, the mean increase is $875. Income funds have a sample standard deviation of $35; growth funds have a sample standard deviation of $45. Assume that the population standard deviations are equal. At the 0.05 significance level, is there a difference in the mean yields of the two funds?
What decision is made about the null hypothesis using an α = 0.05?
(Essay)
4.8/5 (30)
When dependent samples are used to test for differences in the means, we pool the sample variances.
(True/False)
4.9/5 (31)
A national manufacturer of ball bearings is experimenting with two different processes for producing precision ball bearings. It is important that the diameters be as close as possible to an industry standard. The output from each process is sampled and the average error from the industry standard is measured in millimeters. The results are presented next. 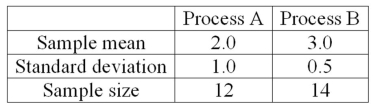 The researcher is interested in determining whether there is evidence that the two processes yield different average errors. The population standard deviations are unknown but assumed equal. What is the alternate hypothesis?
(Multiple Choice)
4.9/5 (34)
When can a paired t-test be used to test a hypothesis of no difference between population means?
(Short Answer)
4.8/5 (37)
An investigation of the effectiveness of a training program to improve customer relationships included a pre-training and post-training customer survey. To compare the differences, they computed (post-training survey score - pre-training survey score). Seven customers were randomly selected and completed both surveys. The results follow. 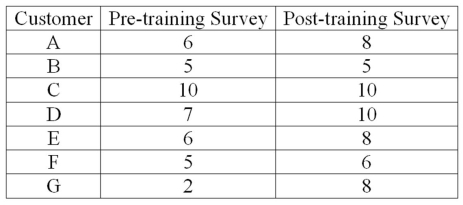 This analysis is an example of _____________.
(Multiple Choice)
4.8/5 (28)
When testing for a difference between the means of two dependent samples, n1 and n2 are ________________.
(Short Answer)
4.7/5 (33)
A national manufacturer of ball bearings is experimenting with two different processes for producing precision ball bearings. It is important that the diameters be as close as possible to an industry standard. The output from each process is sampled and the average error from the industry standard is measured in millimeters. The results are presented next. 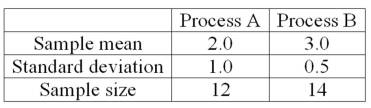 The researcher is interested in determining whether there is evidence that the two processes yield different average errors. The population standard deviations are unknown but are assumed equal. What is the computed value of t?
(Multiple Choice)
4.9/5 (40)
Accounting procedures allow a business to evaluate its inventory costs based on two methods: LIFO (Last In First Out) or FIFO (First In First Out). A manufacturer evaluated its finished goods inventory (in $000s) for five products with the LIFO and FIFO methods. To analyze the difference, they computed (FIFO - LIFO) for each product. Based on the following results, does the LIFO method result in a lower cost of inventory than the FIFO method? 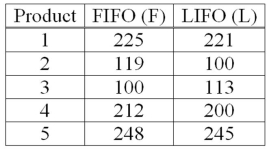 What is the decision at the 5% level of significance?
(Multiple Choice)
4.7/5 (27)
When dependent samples are used to test for differences in the means, we compute paired differences.
(True/False)
4.9/5 (37)
If we are testing for the difference between two population proportions, it is assumed that the sample observations from one population are _____________ of the sample observations from the other population.
(Short Answer)
4.9/5 (44)
A recent study focused on the amount of money single men and women save monthly. The information is summarized next. Assume that the population standard deviations are equal. 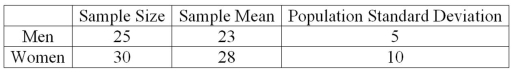 At the .01 significance level, do women save more money than men? What is the critical value for this hypothesis test?
(Multiple Choice)
4.9/5 (37)
When testing for a difference between the means of two dependent samples, the sample test statistic is a ______________.
(Short Answer)
4.8/5 (34)
A study by a bank compared the average savings of customers who were depositors for three years or less, with those who had been depositors for more than three years. The results of a sample are: 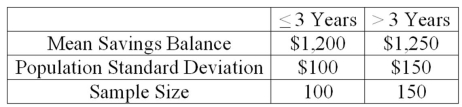 What is the computed test statistic? Round to two decimal places.
(Essay)
4.9/5 (37)
The paired difference test has ___________ degrees of freedom.
(Short Answer)
4.8/5 (30)
A financial planner wants to compare the yield of income and growth mutual funds. Fifty thousand dollars is invested in each of a sample of 35 income and 40 growth funds. The mean increase for a two-year period for the income funds is $900. For the growth funds, the mean increase is $875. Income funds have a sample standard deviation of $35; growth funds have a sample standard deviation of $45. Assume that the population standard deviations are equal. At the 0.05 significance level, is there a difference in the mean yields of the two funds?
What is the p-value for the computed test statistic?
(Essay)
4.8/5 (29)
If we are testing for the difference between two population means and assume that the two populations have equal and unknown standard deviations, the degrees of freedom are computed as (n1)(n2) - 1.
(True/False)
4.9/5 (41)
Filters
- Essay(0)
- Multiple Choice(0)
- Short Answer(0)
- True False(0)
- Matching(0)