Exam 4: Describing Data: Displaying and Exploring Data
Exam 1: What Is Statistics83 Questions
Exam 2: Describing Data: Frequency Tables, Frequency Distributions, and Graphic Presentation132 Questions
Exam 3: Describing Data: Numerical Measures124 Questions
Exam 4: Describing Data: Displaying and Exploring Data113 Questions
Exam 5: A Survey of Probability Concepts134 Questions
Exam 6: Discrete Probability Distributions131 Questions
Exam 7: Continuous Probability Distributions135 Questions
Exam 8: Sampling Methods and the Central Limit Theorem117 Questions
Exam 9: Estimation and Confidence Intervals131 Questions
Exam 10: One-Sample Tests of Hypothesis110 Questions
Exam 11: Two-Sample Tests of Hypothesis98 Questions
Exam 12: Analysis of Variance134 Questions
Exam 13: Correlation and Linear Regression138 Questions
Exam 14: Multiple Regression Analysis135 Questions
Exam 15: Nonparametric Methods: Nominal Level Hypothesis Tests181 Questions
Exam 16: Nonparametric Methods: Analysis of Ordinal Data138 Questions
Exam 17: Index Numbers137 Questions
Exam 18: Time Series and Forecasting139 Questions
Exam 19: Statistical Process Control and Quality Management136 Questions
Exam 20: An Introduction to Decision Theory115 Questions
Select questions type
Given the sample information in the following table regarding public opinion on gun control, what percent of Democrats have no opinion? 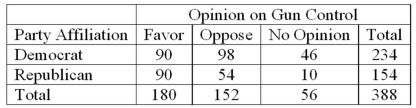
(Essay)
4.9/5  (38)
(38)
A scatter diagram of sales versus production is labeled with sales on the Y-axis and production on the X-axis.
(True/False)
4.9/5 (37)
A telemarketing firm is monitoring the performance of its employees based on the number of sales per hour. One employee had the following sales for the last 19 hours. 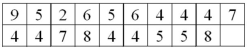 What is the median for the distribution of number of sales per hour?
(Essay)
4.7/5 (35)
The coefficient of skewness is the standard deviation divided by the mean.
(True/False)
4.7/5 (45)
A scatter diagram shows the ____________ between two interval or ratio variables.
(Short Answer)
5.0/5 (30)
The research director of a large oil company studied the buying habits of consumers with respect to the amount of gasoline purchased at full-service pumps. The sample mean amount is 11.5 gallons and the median amount is 11.95 gallons. The standard deviation of the sample is 4.5 gallons. What is Pearson's coefficient of skewness here?
(Essay)
4.8/5 (39)
What is the possible range of values for Pearson's coefficient of skewness?
(Multiple Choice)
4.9/5 (33)
A scatter diagram of sales versus production may be constructed by plotting the minimum, first quartile, median, third quartile, and maximum values of each variable.
(True/False)
4.9/5 (35)
In a positively skewed distribution, the 50th percentile is the same as the ______________.
(Short Answer)
4.9/5 (30)
For the following data, find the information required to construct a box plot. 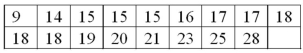
(Essay)
4.8/5 (29)
What is the common purpose of a scatter diagram and a contingency table?
(Short Answer)
4.7/5 (35)
The _____________ unit of measurement is used to express the coefficient of skewness.
(Short Answer)
4.9/5 (30)
A telemarketing firm is monitoring the performance of its employees based on the number of sales per hour. One employee had the following sales for the last 19 hours. 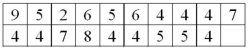 What is the first quartile for the distribution of number of sales per hour?
(Essay)
4.9/5 (37)
Percentiles divide a frequency distribution into _________ equal parts.
(Short Answer)
4.7/5 (30)
The test scores for a class of 147 students are computed. What is the location of the test score associated with the third quartile?
(Multiple Choice)
4.8/5 (28)
A sample of experienced typists revealed that their mean typing speed is 87 words per minute and the median typing speed is 73 words per minute. The standard deviation of typing speed is 16.9 words per minute. What is the Pearson coefficient of skewness?
(Multiple Choice)
4.8/5 (46)
The following stem-and-leaf display reports the number of boats shipped per week by Ottertail Boats, Inc.
11| 1 5 9
12| 0 1 2 2 6 9
13| 0 1 2 3 4 5 5 7 8 8 9
14| 2 6 8
15| 0 1 2 4 5 7 8 9
16| 1 5 7 9
How many weeks were included in the study?
(Short Answer)
4.8/5 (35)
Filters
- Essay(0)
- Multiple Choice(0)
- Short Answer(0)
- True False(0)
- Matching(0)