Exam 4: Describing Data: Displaying and Exploring Data
Exam 1: What Is Statistics83 Questions
Exam 2: Describing Data: Frequency Tables, Frequency Distributions, and Graphic Presentation132 Questions
Exam 3: Describing Data: Numerical Measures124 Questions
Exam 4: Describing Data: Displaying and Exploring Data113 Questions
Exam 5: A Survey of Probability Concepts134 Questions
Exam 6: Discrete Probability Distributions131 Questions
Exam 7: Continuous Probability Distributions135 Questions
Exam 8: Sampling Methods and the Central Limit Theorem117 Questions
Exam 9: Estimation and Confidence Intervals131 Questions
Exam 10: One-Sample Tests of Hypothesis110 Questions
Exam 11: Two-Sample Tests of Hypothesis98 Questions
Exam 12: Analysis of Variance134 Questions
Exam 13: Correlation and Linear Regression138 Questions
Exam 14: Multiple Regression Analysis135 Questions
Exam 15: Nonparametric Methods: Nominal Level Hypothesis Tests181 Questions
Exam 16: Nonparametric Methods: Analysis of Ordinal Data138 Questions
Exam 17: Index Numbers137 Questions
Exam 18: Time Series and Forecasting139 Questions
Exam 19: Statistical Process Control and Quality Management136 Questions
Exam 20: An Introduction to Decision Theory115 Questions
Select questions type
The types of variables called _______________ are summarized in a contingency table.
(Short Answer)
4.9/5  (34)
(34)
A dot plot is an easy way to represent the relationship between two variables.
(True/False)
4.9/5 (33)
A large oil company is studying the number of gallons of gasoline purchased per customer at self-service pumps. The mean number of gallons is 10.0, with a standard deviation of 3.0 gallons. The median is 10.75 gallons. What is Pearson's coefficient of skewness in this instance?
(Multiple Choice)
4.8/5 (40)
In a scatter diagram, we describe the relationship between __________.
(Multiple Choice)
4.9/5 (35)
In the following set of data:  what are the first, second, and third quartiles?
(Multiple Choice)
4.9/5 (44)
In a negatively skewed distribution, the coefficient of skewness is ______________.
(Short Answer)
4.8/5 (21)
A relationship between two nominal variables is summarized by a contingency table.
(True/False)
4.8/5 (28)
For the following data, find the information required to construct a box plot. 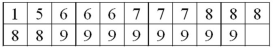
(Essay)
4.9/5 (35)
A telemarketing firm is monitoring the performance of its employees based on the number of sales per hour. One employee had the following sales for the last 19 hours. 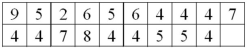 For the distribution of number of sales per hour, what is the interquartile range?
(Essay)
4.8/5 (37)
In a stem-and-leaf display, the leaf represents a class of a frequency distribution.
(True/False)
4.8/5 (33)
In a contingency table, we describe the relationship between ________.
(Multiple Choice)
4.8/5 (35)
The following stem-and-leaf display reports the number of boats shipped per week by Ottertail Boats, Inc.
11| 1 5 9
12| 0 1 2 2 6 9
13| 0 1 2 3 4 5 5 7 8 8 9
14| 2 6 8
15| 0 1 2 4 5 7 8 9
16| 1 5 7 9
How often did the company ship 111 boats in a week?
(Short Answer)
4.8/5 (25)
A telemarketing firm is monitoring the performance of its employees based on the number of sales per hour. One employee had the following sales for the last 20 hours. Draw a dot plot for the data. 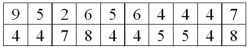
(Essay)
4.7/5 (36)
In a symmetric distribution, is the 99th percentile is located in the ________ tail.
(Short Answer)
4.9/5 (27)
Filters
- Essay(0)
- Multiple Choice(0)
- Short Answer(0)
- True False(0)
- Matching(0)