Exam 4: Describing Data: Displaying and Exploring Data
Exam 1: What Is Statistics83 Questions
Exam 2: Describing Data: Frequency Tables, Frequency Distributions, and Graphic Presentation132 Questions
Exam 3: Describing Data: Numerical Measures124 Questions
Exam 4: Describing Data: Displaying and Exploring Data113 Questions
Exam 5: A Survey of Probability Concepts134 Questions
Exam 6: Discrete Probability Distributions131 Questions
Exam 7: Continuous Probability Distributions135 Questions
Exam 8: Sampling Methods and the Central Limit Theorem117 Questions
Exam 9: Estimation and Confidence Intervals131 Questions
Exam 10: One-Sample Tests of Hypothesis110 Questions
Exam 11: Two-Sample Tests of Hypothesis98 Questions
Exam 12: Analysis of Variance134 Questions
Exam 13: Correlation and Linear Regression138 Questions
Exam 14: Multiple Regression Analysis135 Questions
Exam 15: Nonparametric Methods: Nominal Level Hypothesis Tests181 Questions
Exam 16: Nonparametric Methods: Analysis of Ordinal Data138 Questions
Exam 17: Index Numbers137 Questions
Exam 18: Time Series and Forecasting139 Questions
Exam 19: Statistical Process Control and Quality Management136 Questions
Exam 20: An Introduction to Decision Theory115 Questions
Select questions type
A telemarketing firm is monitoring the performance of its employees based on the number of sales per hour. One employee had the following sales for the last 19 hours. 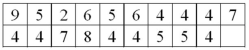 For the distribution of number of sales per hour, 50% are equal or greater than ___________.
(Essay)
4.9/5  (33)
(33)
The coefficient of skewness measures a distribution's ____________ symmetry.
(Short Answer)
4.7/5 (29)
In a stem-and-leaf display, the leaf represents the members of a class in a frequency distribution.
(True/False)
4.9/5 (35)
A stem-and-leaf display includes the following row: 3 | 0 1 3 5 7 9. Assume that the data is rounded to the nearest whole number. Which of the following statements is true?
(Multiple Choice)
4.9/5 (34)
In a distribution, the second quartile corresponds with the __________.
(Multiple Choice)
4.8/5 (41)
The ______________ is used to measure the relative symmetry of a distribution.
(Short Answer)
4.9/5 (26)
The interquartile range is graphically presented in a ___________.
(Multiple Choice)
4.9/5 (38)
Filters
- Essay(0)
- Multiple Choice(0)
- Short Answer(0)
- True False(0)
- Matching(0)