Exam 1: Economic Questions and Data
Exam 1: Economic Questions and Data17 Questions
Exam 2: Review of Probability70 Questions
Exam 3: Review of Statistics65 Questions
Exam 4: Linear Regression With One Regressor65 Questions
Exam 5: Regression With a Single Regressor: Hypothesis Tests and Confidence Intervals59 Questions
Exam 6: Linear Regression With Multiple Regressors65 Questions
Exam 7: Hypothesis Tests and Confidence Intervals in Multiple Regression64 Questions
Exam 8: Nonlinear Regression Functions63 Questions
Exam 9: Assessing Studies Based on Multiple Regression65 Questions
Exam 10: Regression With Panel Data50 Questions
Exam 11: Regression With a Binary Dependent Variable50 Questions
Exam 12: Instrumental Variables Regression50 Questions
Exam 13: Experiments and Quasi-Experiments50 Questions
Exam 14: Introduction to Time Series Regression and Forecasting50 Questions
Exam 15: Estimation of Dynamic Causal Effects50 Questions
Exam 16: Additional Topics in Time Series Regression50 Questions
Exam 17: The Theory of Linear Regression With One Regressor49 Questions
Exam 18: The Theory of Multiple Regression50 Questions
Select questions type
Econometrics can be defined as follows with the exception of
Free
(Multiple Choice)
4.8/5  (33)
(33)
Correct Answer: Verified
D
An example of a randomized controlled experiment is when
Free
(Multiple Choice)
4.9/5 (35)
Correct Answer:Verified
D
Give at least three examples from economics where each of the following type of data can be used: cross-sectional data, time series data, and panel data.
Free
(Essay)
4.9/5 (33)
Correct Answer:Verified
Answers will vary by student. At this level of economics, students most likely have heard of the following use of cross-sectional data: earnings functions, growth equations, the effect of class size reduction on student performance (in this chapter), demand functions (in this chapter: cigarette consumption); time series: the Phillips curve (in this chapter), consumption functions, Okun's law; panel data: various U.S. state panel studies on road fatalities (in this book), unemployment rate and unemployment benefits variations, growth regressions (across states and countries), and crime and abortion (Freakonomics).
The reason why economists do not use experimental data more frequently is for all of the following reasons except that real-world experiments
(Multiple Choice)
4.8/5 (33)
Analyzing the behavior of unemployment rates across U.S. states in March of 2006 is an example of using
(Multiple Choice)
4.9/5 (35)
The most frequently used experimental or observational data in econometrics are of the following type:
(Multiple Choice)
4.8/5 (39)
Studying inflation in the United States from 1970 to 2006 is an example of using
(Multiple Choice)
4.8/5 (28)
One of the primary advantages of using econometrics over typical results from economic theory, is that
(Multiple Choice)
4.8/5 (34)
In the graph below, the vertical axis represents average real GDP growth for 65 countries over the period 1960-1995, and the horizontal axis shows the average trade share within these countries. 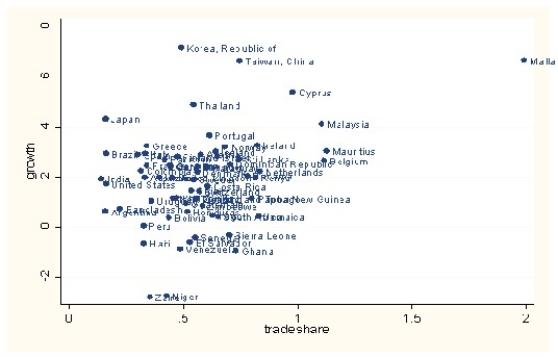 This is an example of
(Multiple Choice)
4.8/5 (39)
Analyzing the effect of minimum wage changes on teenage employment across the 48 contiguous U.S. states from 1980 to 2004 is an example of using
(Multiple Choice)
4.9/5 (39)
Filters
- Essay(0)
- Multiple Choice(0)
- Short Answer(0)
- True False(0)
- Matching(0)