Exam 7: Hypothesis Tests and Confidence Intervals in Multiple Regression
Exam 1: Economic Questions and Data17 Questions
Exam 2: Review of Probability70 Questions
Exam 3: Review of Statistics65 Questions
Exam 4: Linear Regression With One Regressor65 Questions
Exam 5: Regression With a Single Regressor: Hypothesis Tests and Confidence Intervals59 Questions
Exam 6: Linear Regression With Multiple Regressors65 Questions
Exam 7: Hypothesis Tests and Confidence Intervals in Multiple Regression64 Questions
Exam 8: Nonlinear Regression Functions63 Questions
Exam 9: Assessing Studies Based on Multiple Regression65 Questions
Exam 10: Regression With Panel Data50 Questions
Exam 11: Regression With a Binary Dependent Variable50 Questions
Exam 12: Instrumental Variables Regression50 Questions
Exam 13: Experiments and Quasi-Experiments50 Questions
Exam 14: Introduction to Time Series Regression and Forecasting50 Questions
Exam 15: Estimation of Dynamic Causal Effects50 Questions
Exam 16: Additional Topics in Time Series Regression50 Questions
Exam 17: The Theory of Linear Regression With One Regressor49 Questions
Exam 18: The Theory of Multiple Regression50 Questions
Select questions type
The homoskedasticity only F-statistic is given by the formula 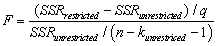 where SSRrestricted is the sum of squared residuals from the restricted regression, SSRunrestricted is the sum of squared residuals from the unrestricted regression, q is the number of restrictions under the null hypothesis, and kunrestricted is the number of regressors in the unrestricted regression. Prove that this formula is the same as the following formula based on the regression R2 of the restricted and unrestricted regression:
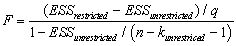
(Essay)
4.8/5  (33)
(33)
All of the following are true, with the exception of one condition:
(Multiple Choice)
4.8/5 (36)
The homoskedasticity-only F-statistic is given by the following formula
(Multiple Choice)
4.8/5 (29)
Consider the regression output from the following unrestricted model:
Unrestricted model:
Dependent Variable: TESTSCR
Method: Least Squares
Date: 07/31/06 Time: 17:35
Sample: 1 420
Included observations: 420 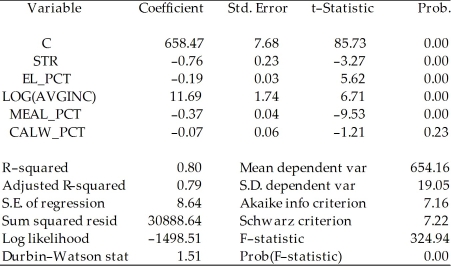 To test for the null hypothesis that neither coefficient on the percent eligible for subsidized lunch nor the coefficient on the percent on public income assistance is statistically significant, you have your statistical package plot the confidence set. Interpret the graph below and explain what it tells you about the null hypothesis.
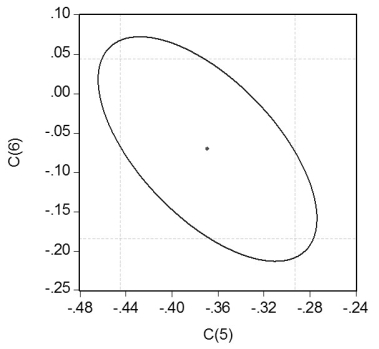
(Essay)
4.8/5 (27)
Filters
- Essay(0)
- Multiple Choice(0)
- Short Answer(0)
- True False(0)
- Matching(0)