Exam 11: Statistical Inference Concerning Variance
Exam 1: Statistics and Data102 Questions
Exam 2: Tabular and Graphical Methods123 Questions
Exam 3: Numerical Descriptive Measures152 Questions
Exam 4: Introduction to Probability148 Questions
Exam 5: Discrete Probability Distributions158 Questions
Exam 6: Continuous Probability Distributions143 Questions
Exam 7: Sampling and Sampling Distributions136 Questions
Exam 8: Interval Estimation131 Questions
Exam 9: Hypothesis Testing116 Questions
Exam 10: Statistical Inference Concerning Two Populations131 Questions
Exam 11: Statistical Inference Concerning Variance120 Questions
Exam 12: Chi-Square Tests120 Questions
Exam 13: Analysis of Variance120 Questions
Exam 14: Regression Analysis140 Questions
Exam 15: Inference With Regression Models125 Questions
Exam 16: Regression Models for Nonlinear Relationships118 Questions
Exam 17: Regression Models With Dummy Variables130 Questions
Exam 18: Time Series and Forecasting125 Questions
Exam 19: Returns, Index Numbers, and Inflation120 Questions
Exam 20: Nonparametric Tests120 Questions
Select questions type
Suppose Apple would like to test the hypothesis that the standard deviation for the web-browsing battery life of the iPad is different from 3.0 hours. The following data represents the battery life, in hours, experienced by a random sample of six users: 10 14 12 16 10 6.
Which of the following would be the correct hypothesis test?
(Multiple Choice)
5.0/5  (36)
(36)
The manager of a video library would like the variance of the waiting times of the customers not to exceed 2.30 minutes-squared. He would like to add an additional billing counter if the variance exceeds the cut-off. He checks the recent sample data. For a random sample of 24 customer waiting times, he arrives at a sample variance of 3.8 minutes-squared. The manager assumes the waiting times to be normally distributed. Which of the following would be null and the alternate hypothesis to test if the cut-off is surpassed?
(Multiple Choice)
4.8/5 (37)
Use the R function ________ to obtain left-tail probabilities of the chi-square distribution.
(Short Answer)
5.0/5 (42)
It is preferable to place the smaller sample variance in the numerator of the  statistic.
(True/False)
4.8/5 (36)
Construct a 95% confidence interval for the ratios of two population variances. The random samples of n1= 9 and n2= 11 with sample variances of  = 500 and
  = 250, respectively. Assume that the samples were drawn from a normal population.
(Multiple Choice)
4.9/5 (42)
A professor wants to compare the variances of scores between two sections of classes. The students in each section took the same test. The random samples yield sample variances of  = 203.15 and
  = 474.42 for samples of n1 = 13 and n2 = 16, respectively. Which of the following is a 99% confidence interval for the ratio of the population variances?
(Multiple Choice)
4.8/5 (37)
The skewness of the chi-square distribution depends on the degrees of freedom.
(True/False)
4.9/5 (37)
The specification of the confidence interval for the ratio of two population variances is based on the assumption that the sample variances are computed from ________ drawn samples from two normally distributed populations.
(Short Answer)
4.8/5 (35)
The supervisor of an automobile sales and service industry would like the variance of the number of automobiles serviced not to exceed five units-squared. He would recruit one more service executive if the variance exceeds this threshold. In a recent random sample of 14 services, he computed the sample standard deviation as 3.3. He believes that the automobile services are normally distributed.
A) State the null and the alternative hypotheses to test if the threshold has been crossed.
B) Use the critical value approach to conduct the test at α = 0.01.
C) What should the supervisor do?
(Essay)
4.8/5 (37)
A financial analyst maintains that the risk, measured by the variance, of investing in emerging markets is more than 280(%)2. Data on 20 stocks from emerging markets revealed the following sample results:  = 12.1% and s2 = 361(%)2. Assume that the returns are normally distributed. Which of the following is the correct value of the test statistic?
(Multiple Choice)
4.7/5 (31)
If independent samples of size n1 and n2 are drawn from normal populations with equal variances, then the value of the  statistic is calculated as
(Multiple Choice)
4.8/5 (37)
You want to test whether the population variance differs from 50. From a sample of 25 observations drawn from a normally distributed population, you calculate s2 = 80. When conducting this test at the 5% significance level, the,  critical value is
(Multiple Choice)
4.9/5 (34)
Suppose Apple would like to test the hypothesis that the standard deviation for the web-browsing battery life of the iPad is different from 3.0 hours. The following data represents the battery life, in hours, experienced by a random sample of six users: 10 14 12 16 10 6. A 95% confidence interval for variance of the battery life is given by [4.78, 73.79]. What is the decision and conclusion?
(Multiple Choice)
4.9/5 (31)
The following data, drawn from a normal population, are the waiting times (in minutes) of 12 randomly selected customers at a travel desk.
1.8 2.4 2.7 2.1 1.3 1.7 1.5 1.5 2.3 2.8 2.5 1.9
A) Calculate the point estimates of the population variance and the population standard deviation.
B) Compute a 90% confidence intervals for the population variance and the population standard deviation.
(Essay)
4.8/5 (37)
Which of the following is the formula for a confidence interval for the ratio of the population variances  /
/  ?
?
(Multiple Choice)
5.0/5 (32)
Amie Jackson, a manager at Sigma travel services, makes every effort to ensure that customers attempting to make online reservations do not have to wait too long to complete the reservation process. The travel website is open for reservations 24 hours a day, and Amie regularly checks the website for the waiting time to maintain consistency in service. She uses the following independently drawn samples of wait time during two peak hours, morning 8 a.m. to 10 a.m. and evening 7 p.m. to 9 p.m., for the analysis. Assume that wait times are normally distributed.  At the 10% significance level, which of the following is the correct conclusion?
(Multiple Choice)
4.7/5 (44)
Consider the following competing hypotheses and relevant summary statistics:
Η0:  /
/  = 1, ΗA:
  /
/  ≠ 1. Use the following results from two independently drawn samples from normally distributed populations.
 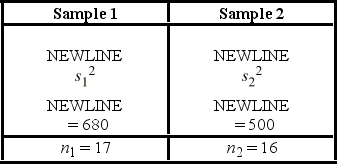 a. Using the critical value approach, conduct this hypothesis test at the 5% significance level. What are the assumptions?
B) Confirm the conclusions by using the p-value approach.
a. Using the critical value approach, conduct this hypothesis test at the 5% significance level. What are the assumptions?
B) Confirm the conclusions by using the p-value approach.
(Essay)
4.9/5 (36)
Students of two sections of a history course took a common final examination. The course instructor examines the variance in scores between the two sections. He selects random samples of n1 = 11 and n2 = 16 with sample variances of  = 400 and
  = 200, respectively. Suppose you obtain a 95% confidence for the ratio of the population variances. Which of the below allows you to conclude the first variance is smaller than the second variance?
(Multiple Choice)
4.7/5 (44)
Filters
- Essay(0)
- Multiple Choice(0)
- Short Answer(0)
- True False(0)
- Matching(0)