Exam 11: Statistical Inference Concerning Variance
Exam 1: Statistics and Data102 Questions
Exam 2: Tabular and Graphical Methods123 Questions
Exam 3: Numerical Descriptive Measures152 Questions
Exam 4: Introduction to Probability148 Questions
Exam 5: Discrete Probability Distributions158 Questions
Exam 6: Continuous Probability Distributions143 Questions
Exam 7: Sampling and Sampling Distributions136 Questions
Exam 8: Interval Estimation131 Questions
Exam 9: Hypothesis Testing116 Questions
Exam 10: Statistical Inference Concerning Two Populations131 Questions
Exam 11: Statistical Inference Concerning Variance120 Questions
Exam 12: Chi-Square Tests120 Questions
Exam 13: Analysis of Variance120 Questions
Exam 14: Regression Analysis140 Questions
Exam 15: Inference With Regression Models125 Questions
Exam 16: Regression Models for Nonlinear Relationships118 Questions
Exam 17: Regression Models With Dummy Variables130 Questions
Exam 18: Time Series and Forecasting125 Questions
Exam 19: Returns, Index Numbers, and Inflation120 Questions
Exam 20: Nonparametric Tests120 Questions
Select questions type
Which of the following hypotheses is a right-tail test about the population variance?
(Multiple Choice)
5.0/5  (33)
(33)
Consider the expected returns (in percent) from the two investment options. Beth claims that the variances of the returns for the two investments differ. Use the following data to arrive at the results.  Test Beth's claim at the 5% significance level. Which of the following is the correct conclusion?
(Multiple Choice)
4.8/5 (43)
Which of the following is used to conduct a hypothesis test about the population variance?
(Multiple Choice)
4.8/5 (31)
The value of the test statistic for the hypothesis test of the population variance, σ2 is computed as  =
=  .
.
(True/False)
4.9/5 (33)
The following are the competing hypotheses and the relevant summary statistics: Η0:  /
/  ≤ 1, ΗA:
  /
/  > 1.
> 1. 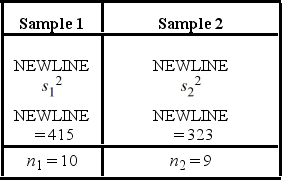 The p-value associated with the value of the test statistic is 0.3692. At the 5% significance level, which of the following conclusions is correct?
(Multiple Choice)
4.8/5 (41)
A researcher compares the returns for two mutual funds, Smith, Inc. and Campbell, Inc. to determine which of the two has a higher risk rate. She assumes that the returns are normally distributed. Implement the critical value approach at a significance level of 10%. The sample descriptive measures are given below. 
(Essay)
4.9/5 (39)
Annual growth rates for individual firms in the toy industry tend to fluctuate dramatically, depending on consumers'; tastes and current fads. Consider the following growth rates (in percent) for two companies in this industry, Hasbro and Mattel. 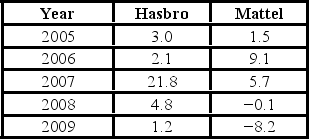 Which of the following is the correct conclusion?
(Multiple Choice)
4.8/5 (28)
The following table shows the annual returns (in percent) for Fidelity's Technology and Communications funds for the years 2006 through 2010.  Use the critical value approach to test if the population variances differ at the 10% significance level.
(Essay)
4.9/5 (31)
Use the F table to approximate these probabilities.
A) P(F(8,12) ≥ 2.85)
B) P(F(8,12) < 0.4)
C) P(F(5,5) ≥ 7.15)
D) P(F(5,5) < 0.09)
(Short Answer)
4.7/5 (40)
If a sample of size n is taken from a normal population with a finite variance, then the statistic  =
=  follows the
  distribution with degrees of freedom.
(Multiple Choice)
4.9/5 (38)
The following are the measures based on independently drawn samples from normally distributed populations. 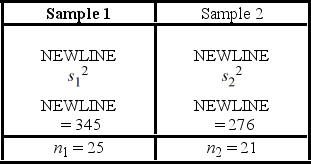 a. Construct a 90% interval estimate of the ratio of the population variances.
B) Test if the ratio of the population variances differs from Sample 1, using the computed confidence interval, at the 10% significance level.
a. Construct a 90% interval estimate of the ratio of the population variances.
B) Test if the ratio of the population variances differs from Sample 1, using the computed confidence interval, at the 10% significance level.
(Essay)
4.8/5 (27)
The result of placing a larger sample variance in the numerator of the  test statistic allows us to
(Multiple Choice)
4.8/5 (40)
Consider the expected returns (in percent) from two investment options. Beth wants to determine if investment 1 has a lower variance. Use the following summary statistics. 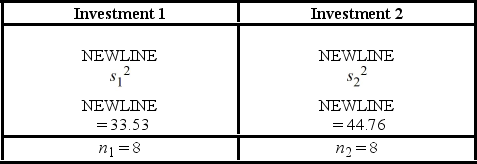 Which of the following are the competing hypotheses for this test?
(Multiple Choice)
4.8/5 (36)
The null hypothesis H0: σ2 ≤  is rejected if the value of the test statistic exceeds
  .
.
(True/False)
4.8/5 (32)
The sales price (in $1,000) of three-bedroom apartments in two cities-Houston, Texas, and Orlando, Florida-are given in the following table. Houston is known to have lower house prices than Orlando; however, it is not clear if it also has lesser variability in its prices.  a. State the null and the alternative hypotheses to determine if the variance of house price in Houston is less than that in Orlando.
B) What assumption regarding the population is necessary to implement this step?
C) Test the hypothesis at α = 0.05. What is your conclusion?
a. State the null and the alternative hypotheses to determine if the variance of house price in Houston is less than that in Orlando.
B) What assumption regarding the population is necessary to implement this step?
C) Test the hypothesis at α = 0.05. What is your conclusion?
(Essay)
4.9/5 (36)
A financial analyst examines the performance of two mutual funds and claims that the variances of the annual returns for the bond funds differ. To support his claim, he collects data on the annual returns (in percent) for the years 2001 through 2010. The analyst assumes that the annual returns for the two emerging market bond funds are normally distributed. Use the following summary statistics.  The competing hypotheses are Η0:
  /
/  = 1, ΗA:
  /
/  ≠ 1. At α = 0.10, is the analyst's claim supported by the data using the critical value approach?
(Multiple Choice)
4.8/5 (30)
The manager of a video library would like the variance of the waiting times of the customers not to exceed 2.30 minutes-squared. He would like to add an additional billing counter if the variance exceeds the cut-off. He checks the recent sample data. For a random sample of 24 customer waiting times, he arrives at a sample variance of 3.8 minutes-squared. The manager assumes the waiting times to be normally distributed. At α = 0.05, which of the following is the critical value  ?
?
(Multiple Choice)
4.8/5 (40)
Find the value x for which
A) P(  ≥ x) = 0.10.
B) P(
≥ x) = 0.10.
B) P(  < x) = 0.10.
C) P(
< x) = 0.10.
C) P(  ≥ x) = 0.05.
D) P(
≥ x) = 0.05.
D) P(  < x) = 0.05.
(Short Answer)
4.9/5 (32)
Amie Jackson, a manager at Sigma travel services, makes every effort to ensure that customers attempting to make online reservations do not have to wait too long to complete the reservation process. The travel website is open for reservations 24 hours a day, and Amie regularly checks the website for the waiting time to maintain consistency in service. She uses the following independently drawn samples of wait time during two peak hours, morning 8 a.m. to 10 a.m., and evening 7 p.m. to 9 p.m., for the analysis. Assume that wait times are normally distributed.  Which of the following is the correct hypotheses to determine if the variance of wait time during morning peak hours (population 1) differs from that during the evening peak hours (population 2)?
(Multiple Choice)
4.8/5 (30)
Filters
- Essay(0)
- Multiple Choice(0)
- Short Answer(0)
- True False(0)
- Matching(0)