Exam 11: Inferences About Population Variances
Exam 1: Data and Statistics85 Questions
Exam 2: Descriptive Statistics: Tabular and Graphical Displays112 Questions
Exam 3: Descriptive Statistics: Numerical Measures139 Questions
Exam 4: Introduction to Probability129 Questions
Exam 5: Discrete Probability Distributions150 Questions
Exam 6: Continuous Probability Distributions144 Questions
Exam 7: Sampling and Sampling Distributions119 Questions
Exam 8: Interval Estimation118 Questions
Exam 9: Hypothesis Tests118 Questions
Exam 10: Inference About Means and Proportions With Two Populations127 Questions
Exam 11: Inferences About Population Variances113 Questions
Exam 12: Tests of Goodness of Fit, Independence and Multiple Proportions76 Questions
Exam 13: Experimental Design and Analysis of Variance125 Questions
Exam 14: Simple Linear Regression103 Questions
Exam 15: Multiple Regression109 Questions
Exam 16: Regression Analysis: Model Building82 Questions
Exam 17: Time Series Analysis and Forecasting80 Questions
Exam 18: Nonparametric Methods83 Questions
Exam 19: Statistical Methods for Quality Control75 Questions
Exam 20: Decision Analysis71 Questions
Exam 21: Sample Survey68 Questions
Select questions type
A sample of 22 bottles of soft drink showed a variance of 0.64 in their contents. At a 5% level of significance, determine whether or not the standard deviation of the population is significantly different from 0.7.
Free
(Essay)
4.7/5  (31)
(31)
Correct Answer: Verified
 Do not reject H0, there is not sufficient evidence to conclude that the standard deviation of the population is significantly different from 0.7
A random sample of 31 charge sales showed a sample standard deviation of $50. A 90% confidence interval estimate of the population standard deviation is
Free
(Multiple Choice)
4.9/5 (34)
Correct Answer:Verified
D
A professor believes the variability in time to complete tests has increased. In the past, the variance in minutes to complete a particular test was 25. The time it takes to complete a test was recorded for a sample of 15 students. The results follow.  Use Excel to determine if the variance in times has increased. Use a .02 level of significance.
Free
(Essay)
4.7/5 (22)
Correct Answer:Verified
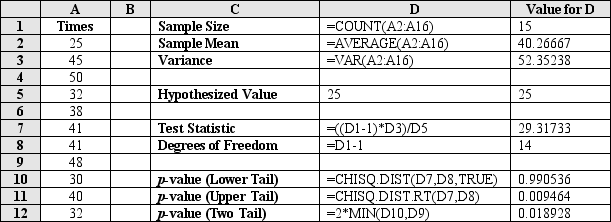 Reject H0, there is sufficient evidence to conclude that the variance in times has increased
A sample of 15 items provides a sample mean of 18 and a sample variance of 16. Compute a 95% confidence interval estimate for the standard deviation of the population.
(Short Answer)
4.9/5 (35)
A machine produces pipes used in airplanes. The average length of the pipe is 16 inches. The acceptable variance for the length is .3 inches. A sample of 25 pipes was taken. The average length in the sample was 15.95 inches with a variance of .4 inches.
a.Construct a 95% confidence interval for the population variance.
b.State the null and alternative hypotheses to be tested.
c.Compute the test statistic.
d.The null hypothesis is to be tested at the 5% level of significance. State the decision rule for the test.
e.What do you conclude about the population variance?
(Essay)
4.7/5 (38)
Do the following data indicate that the variance of the population from which this sample has been drawn is 17? Use = 0.05. 
(Essay)
4.8/5 (37)
A sample of 30 items provided a sample mean of 28 and a sample standard deviation of 6. Test the following hypotheses using = 0.05. What is your conclusion?
H0:  2 < 25
Ha:
2 < 25
Ha:  2 > 25
(Essay)
4.7/5 (36)
In practice, the most frequently encountered hypothesis test about a population variance is a
(Multiple Choice)
4.8/5 (36)
Exhibit 11-6  We want to test the hypothesis that the population variances are equal.
-Refer to Exhibit 11-6. The null hypothesis
We want to test the hypothesis that the population variances are equal.
-Refer to Exhibit 11-6. The null hypothesis
(Multiple Choice)
4.8/5 (29)
Exhibit 11-10  -Refer to Exhibit 11-10. The test statistic for this problem equals
(Multiple Choice)
4.9/5 (43)
Exhibit 11-6 We want to test the hypothesis that the population variances are equal.
-Refer to Exhibit 11-6. The null hypothesis is to be tested at the 10% level of significance. The critical value from the table is
(Multiple Choice)
4.8/5 (25)
We are interested in testing to see if the variance of a population is less than 7. The correct null hypothesis is
(Multiple Choice)
4.7/5 (35)
The chi-square values (for interval estimation) for a sample size of 10 at 95% confidence are
(Multiple Choice)
4.9/5 (33)
The specifications for the filling of soft drink bottles is a variance of 0.05 (ounces)2. A sample of 20 bottles of soft drink showed the following results.  At a 5% level of significance, use Excel to determine whether or not the variance of the population is significantly different from 0.05.
(Essay)
4.8/5 (39)
Exhibit 11-2
We are interested in determining whether or not the variances of the sales at two music stores (A and B) are equal. A sample of 25 days of sales at store A has a sample standard deviation of 30 while a sample of 16 days of sales from store B has a sample standard deviation of 20.
-Refer to Exhibit 11-2. The test statistic is
(Multiple Choice)
4.9/5 (37)
We are interested in testing whether the variance of a population is significantly less than 1.44. The null hypothesis for this test is
(Multiple Choice)
4.9/5 (27)
A random sample of 21 checking accounts at a bank showed an average daily balance of $430 with a standard deviation of $50.
a.Provide a 95% confidence interval estimate of the variance of the population of the checking accounts.
b.Provide a 95% confidence interval estimate of the standard deviation of the population of the checking accounts.
(Short Answer)
4.9/5 (40)
The time it takes to complete a test was recorded for a sample of 15 students. The results follow.  Use Excel to estimate the variance with a 90% level of confidence.
(Essay)
4.8/5 (38)
A random sample of 25 employees of a local utility firm showed that their monthly incomes had a sample standard deviation of $112. Provide a 90% confidence interval estimate for the standard deviation of the incomes for all the firm's employees.
(Short Answer)
4.8/5 (29)
Filters
- Essay(0)
- Multiple Choice(0)
- Short Answer(0)
- True False(0)
- Matching(0)