Exam 3: Descriptive Statistics: Numerical Measures
Exam 1: Data and Statistics85 Questions
Exam 2: Descriptive Statistics: Tabular and Graphical Displays112 Questions
Exam 3: Descriptive Statistics: Numerical Measures139 Questions
Exam 4: Introduction to Probability129 Questions
Exam 5: Discrete Probability Distributions150 Questions
Exam 6: Continuous Probability Distributions144 Questions
Exam 7: Sampling and Sampling Distributions119 Questions
Exam 8: Interval Estimation118 Questions
Exam 9: Hypothesis Tests118 Questions
Exam 10: Inference About Means and Proportions With Two Populations127 Questions
Exam 11: Inferences About Population Variances113 Questions
Exam 12: Tests of Goodness of Fit, Independence and Multiple Proportions76 Questions
Exam 13: Experimental Design and Analysis of Variance125 Questions
Exam 14: Simple Linear Regression103 Questions
Exam 15: Multiple Regression109 Questions
Exam 16: Regression Analysis: Model Building82 Questions
Exam 17: Time Series Analysis and Forecasting80 Questions
Exam 18: Nonparametric Methods83 Questions
Exam 19: Statistical Methods for Quality Control75 Questions
Exam 20: Decision Analysis71 Questions
Exam 21: Sample Survey68 Questions
Select questions type
If two groups of numbers have the same mean, then their
Free
(Multiple Choice)
4.9/5  (28)
(28)
Correct Answer: Verified
D
Paul, a freshman at a local college just completed 15 credit hours. His grade report is presented below.  The local university uses a 4 point grading system, i.e., A = 4, B = 3, C = 2, D = 1, F = 0. Compute Paul's semester grade point average.
Free
(Short Answer)
4.9/5 (32)
Correct Answer:Verified
2.6
The value of the sum of the squared deviations from the mean, i.e.,  must always be
Free
(Multiple Choice)
4.8/5 (35)
Correct Answer:Verified
D
Exhibit 3-1
A researcher has collected the following sample data.  -Refer to Exhibit 3-1. The mean is
(Multiple Choice)
4.8/5 (27)
The measure of central location most often reported for annual income and property value data is the
(Multiple Choice)
4.9/5 (39)
Which of the following descriptive statistics is not measured in the same units as the data?
(Multiple Choice)
4.8/5 (41)
The amount of time that a sample of students spends watching television per day is given below.  a.Compute the mean.
b.Compute the median.
c.Compute the standard deviation.
d.Compute the 75th percentile.
a.Compute the mean.
b.Compute the median.
c.Compute the standard deviation.
d.Compute the 75th percentile.
(Short Answer)
4.9/5 (38)
Excel's __________ function can be used to compute the population variance.
(Multiple Choice)
4.7/5 (39)
Exhibit 3-2
A researcher has collected the following sample data. The mean of the sample is 5.  -Refer to Exhibit 3-2. The coefficient of variation is
(Multiple Choice)
4.9/5 (36)
For the following data  Compute the following measures:
a. The mean
b. The variance
c. The standard deviation
d. The coefficient of variation
e. The 25th percentile
f. The median
g. The 75th percentile
Compute the following measures:
a. The mean
b. The variance
c. The standard deviation
d. The coefficient of variation
e. The 25th percentile
f. The median
g. The 75th percentile
(Short Answer)
4.8/5 (40)
Exhibit 3-1
A researcher has collected the following sample data.
-Refer to Exhibit 3-1. The median is
(Multiple Choice)
4.8/5 (27)
The sum of deviations of the individual data elements from their mean is
(Multiple Choice)
4.8/5 (39)
Exhibit 3-4
The following is the frequency distribution for the speeds of a sample of automobiles traveling on an interstate highway.  -Refer to Exhibit 3-4. The standard deviation is
(Multiple Choice)
4.9/5 (39)
When should measures of location and dispersion be computed from grouped data rather than from individual data values?
(Multiple Choice)
4.8/5 (37)
Exhibit 3-2
A researcher has collected the following sample data. The mean of the sample is 5.
-Refer to Exhibit 3-2. The standard deviation is
(Multiple Choice)
4.9/5 (26)
A graphical summary of data that is based on a five-number summary is a
(Multiple Choice)
4.8/5 (33)
A numerical measure computed from a sample, such as sample mean, is known as a
(Multiple Choice)
4.9/5 (37)
Angela Lopez, a golf instructor, is interested in investigating the relationship between a golfer's average driving distance and 18-hole score. She recently observed the performance of six golfers during one round of a tournament and measured, as accurately as possible, the distances (yards) of their drives and noted their final scores. She then computed each golfer's average drive distance for 18 holes. The results of her sample are shown below. 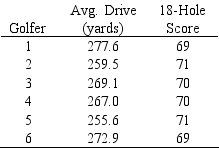 Compute and interpret both the sample covariance and the sample correlation coefficient.
(Essay)
4.9/5 (47)
The coefficient of variation indicates how large the standard deviation is relative to the
(Multiple Choice)
4.7/5 (48)
Filters
- Essay(0)
- Multiple Choice(0)
- Short Answer(0)
- True False(0)
- Matching(0)