Exam 2: Descriptive Statistics: Tabular and Graphical Displays
Exam 1: Data and Statistics85 Questions
Exam 2: Descriptive Statistics: Tabular and Graphical Displays112 Questions
Exam 3: Descriptive Statistics: Numerical Measures139 Questions
Exam 4: Introduction to Probability129 Questions
Exam 5: Discrete Probability Distributions150 Questions
Exam 6: Continuous Probability Distributions144 Questions
Exam 7: Sampling and Sampling Distributions119 Questions
Exam 8: Interval Estimation118 Questions
Exam 9: Hypothesis Tests118 Questions
Exam 10: Inference About Means and Proportions With Two Populations127 Questions
Exam 11: Inferences About Population Variances113 Questions
Exam 12: Tests of Goodness of Fit, Independence and Multiple Proportions76 Questions
Exam 13: Experimental Design and Analysis of Variance125 Questions
Exam 14: Simple Linear Regression103 Questions
Exam 15: Multiple Regression109 Questions
Exam 16: Regression Analysis: Model Building82 Questions
Exam 17: Time Series Analysis and Forecasting80 Questions
Exam 18: Nonparametric Methods83 Questions
Exam 19: Statistical Methods for Quality Control75 Questions
Exam 20: Decision Analysis71 Questions
Exam 21: Sample Survey68 Questions
Select questions type
Excel's __________ can be used to construct a frequency distribution for categorical data.
Free
(Multiple Choice)
4.8/5  (38)
(38)
Correct Answer: Verified
D
Before drawing any conclusions about the relationship between two variables shown in a crosstabulation, you should
Free
(Multiple Choice)
4.8/5 (27)
Correct Answer:Verified
A
Excel's Chart Tools does not have a chart type for constructing a
Free
(Multiple Choice)
4.8/5 (41)
Correct Answer:Verified
D
Methods that use simple arithmetic and easy-to-draw graphs to summarize data quickly are called
(Multiple Choice)
4.8/5 (40)
Fill in the missing value for the following percent frequency distribution. 
(Short Answer)
4.8/5 (35)
Two hundred members of a fitness center were surveyed. One survey item stated, "The facilities are always clean." The members' responses to the item are summarized below. Fill in the missing value for the frequency distribution. 
(Short Answer)
4.8/5 (36)
Partial results of a study follow in a crosstabulation of column percentages.  a.Interpret the 18% found in the first row and first column of the crosstabulation.
b.If 50 of those in the study paid by check, how many of the males paid by check?
a.Interpret the 18% found in the first row and first column of the crosstabulation.
b.If 50 of those in the study paid by check, how many of the males paid by check?
(Essay)
4.9/5 (30)
Exhibit 2-1
The numbers of hours worked (per week) by 400 statistics students are shown below.  -Refer to Exhibit 2-1. The relative frequency of students working 9 hours or less
(Multiple Choice)
4.9/5 (32)
Ithaca Log Homes manufactures four styles of log houses that are sold in kits. The price (in $000) and style of homes the company has sold in the past year are shown below.  Prepare a crosstabulation for the variables price and style.
(Essay)
4.9/5 (36)
Exhibit 2-4
A survey of 400 college seniors resulted in the following crosstabulation regarding their undergraduate major and whether or not they plan to go to graduate school.  -Refer to Exhibit 2-4. Among the students who plan to go to graduate school, what percentage indicated "Other" majors?
(Multiple Choice)
4.7/5 (36)
Exhibit 2-3
The number of sick days taken (per month) by 200 factory workers is summarized below.  -Refer to Exhibit 2-3. The number of workers who took at most 10 sick days per month
(Multiple Choice)
4.9/5 (30)
To construct a histogram using Excel's Chart Tools, choose __________ as the chart type.
(Multiple Choice)
4.8/5 (31)
A tabular summary of a set of data showing the fraction of the total number of items in several nonoverlapping classes is a
(Multiple Choice)
4.8/5 (39)
What type of relationship is depicted in the following scatter diagram? 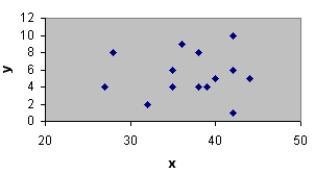
(Short Answer)
4.9/5 (26)
You are given the following data on the ages of employees at a company. Construct a stem-and-leaf display. Specify the leaf unit for the display. 
(Essay)
4.7/5 (35)
To construct a bar chart using Excel's Chart Tools, choose __________ as the chart type.
(Multiple Choice)
4.8/5 (37)
Exhibit 2-2
Information on the type of industry is provided for a sample of 50 Fortune 500 companies.  -Refer to Exhibit 2-2. The number of industries that are classified as retail is
(Multiple Choice)
4.9/5 (30)
Tony Zamora, a real estate investor, has just moved to Clarksville and wants to learn about the local real estate market. He wants to understand, for example, the relationship between geographical segment of the city and selling price of a house, the relationship between selling price and number of bedrooms, and so on. Tony has randomly selected 25 house-for-sale listings from the Sunday newspaper and collected the data listed below. 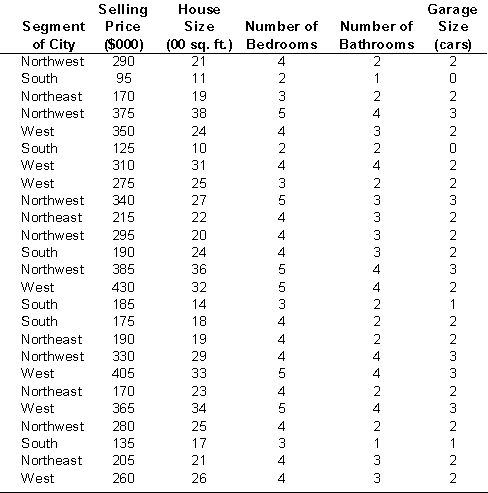 a. Construct a crosstabulation for the variables segment of city and number of bedrooms.
b. Compute the row percentages for your crosstabulation in part (a).
c. Comment on any apparent relationship between the variables.
a. Construct a crosstabulation for the variables segment of city and number of bedrooms.
b. Compute the row percentages for your crosstabulation in part (a).
c. Comment on any apparent relationship between the variables.
(Essay)
4.8/5 (40)
Filters
- Essay(0)
- Multiple Choice(0)
- Short Answer(0)
- True False(0)
- Matching(0)