Exam 13: Experimental Design and Analysis of Variance
Exam 1: Data and Statistics85 Questions
Exam 2: Descriptive Statistics: Tabular and Graphical Displays112 Questions
Exam 3: Descriptive Statistics: Numerical Measures139 Questions
Exam 4: Introduction to Probability129 Questions
Exam 5: Discrete Probability Distributions150 Questions
Exam 6: Continuous Probability Distributions144 Questions
Exam 7: Sampling and Sampling Distributions119 Questions
Exam 8: Interval Estimation118 Questions
Exam 9: Hypothesis Tests118 Questions
Exam 10: Inference About Means and Proportions With Two Populations127 Questions
Exam 11: Inferences About Population Variances113 Questions
Exam 12: Tests of Goodness of Fit, Independence and Multiple Proportions76 Questions
Exam 13: Experimental Design and Analysis of Variance125 Questions
Exam 14: Simple Linear Regression103 Questions
Exam 15: Multiple Regression109 Questions
Exam 16: Regression Analysis: Model Building82 Questions
Exam 17: Time Series Analysis and Forecasting80 Questions
Exam 18: Nonparametric Methods83 Questions
Exam 19: Statistical Methods for Quality Control75 Questions
Exam 20: Decision Analysis71 Questions
Exam 21: Sample Survey68 Questions
Select questions type
Exhibit 13-1  -Refer to Exhibit 13-1. The test statistic to test the null hypothesis equals
Free
(Multiple Choice)
4.9/5  (37)
(37)
Correct Answer: Verified
D
Exhibit 13-2  -Refer to Exhibit 13-2. The mean square between treatments equals
Free
(Multiple Choice)
4.9/5 (32)
Correct Answer:Verified
B
A dietician wants to see if there is any difference in the effectiveness of three diets. Eighteen people, comprising a sample, were randomly assigned to the three diets. Below you are given the total amount of weight lost in a month by each person.  What would you advise the dietician about the effectiveness of the three diets? Use Excel and a .05 level of significance.
Free
(Essay)
4.8/5 (40)
Correct Answer:Verified
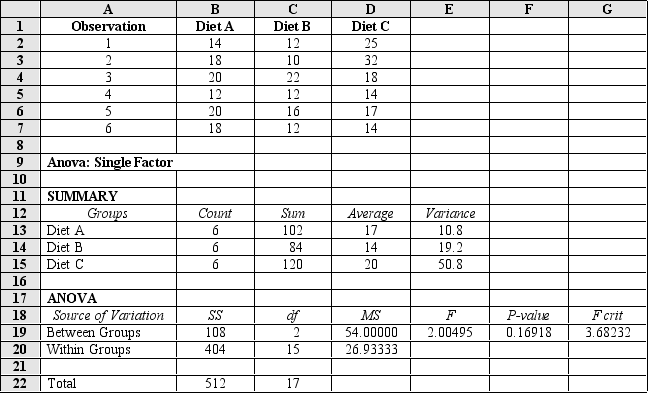 Conclude that the diets are equally effective.
In factorial designs, the response produced when the treatments of one factor interact with the treatments of another in influencing the response variable is known as
(Multiple Choice)
4.9/5 (36)
Exhibit 13-7
The following is part of an ANOVA table, which was the results of three treatments and a total of 15 observations.  -Which of the following is not a required assumption for the analysis of variance?
(Multiple Choice)
4.7/5 (33)
The three major automobile manufacturers have entered their cars in the Indianapolis 500 race. The speeds of the tested cars are given below.  At = .05, use Excel to test to see if there is a significant difference in the average speeds of the cars of the auto manufacturers.
(Essay)
4.8/5 (38)
Exhibit 13-4
In a completely randomized experimental design involving five treatments, thirteen observations were recorded for each of the five treatments. The following information is provided.SSTR = 200 (Sum Square Between Treatments)
SST = 800 (Total Sum Square)
-Refer to Exhibit 13-4. The number of degrees of freedom corresponding to between treatments is
(Multiple Choice)
4.9/5 (41)
Exhibit 13-7
The following is part of an ANOVA table, which was the results of three treatments and a total of 15 observations.
-Refer to Exhibit 13-7. The mean square between treatments (MSTR) is
(Multiple Choice)
4.7/5 (36)
In order to test to see if there is any significant difference in the mean number of units produced per week by each of three production methods, the following data were collected:  At the Alpha = 0.05 level of significance, is there any difference in the mean number of units produced per week by each method? Show the complete ANOVA table. (Please note that the sample sizes are not equal.)
(Essay)
4.8/5 (45)
A factorial experiment involving 2 levels of factor A and 2 levels of factor B resulted in the following.  Set up the ANOVA table and test for any significant main effect and any interaction effect. Use = .05.
(Essay)
4.9/5 (42)
Eight observations were selected from each of 3 populations, and an analysis of variance was performed on the data. The following are part of the results.  Using = .05, test to see if there is a significant difference among the means of the three populations. The sample sizes for the three treatments are equal.
(Essay)
4.8/5 (43)
Exhibit 13-7
The following is part of an ANOVA table, which was the results of three treatments and a total of 15 observations.
-The test scores for selected samples of sociology students who took the course from three different instructors are shown below.  At = 0.05, test to see if there is a significant difference among the averages of the three groups.
(Essay)
4.8/5 (35)
Part of an ANOVA table is shown below.  a.Compute the missing values and fill in the blanks in the above table. Use = .01 to determine if there is any significant difference among the means.
b.How many groups have there been in this problem?
c.What has been the total number of observations?
a.Compute the missing values and fill in the blanks in the above table. Use = .01 to determine if there is any significant difference among the means.
b.How many groups have there been in this problem?
c.What has been the total number of observations?
(Essay)
4.7/5 (33)
Exhibit 13-3
To test whether or not there is a difference between treatments A, B, and C, a sample of 12 observations has been randomly assigned to the 3 treatments. You are given the results below.  -Refer to Exhibit 13-3. The null hypothesis for this ANOVA problem is
(Multiple Choice)
5.0/5 (40)
Exhibit 13-5
Part of an ANOVA table is shown below.  -Refer to Exhibit 13-5. If at a 5% level of significance, we want to determine whether or not the means of the populations are equal, the critical value of F is
(Multiple Choice)
4.8/5 (31)
Regional Manager Sue Collins would like to know if the mean number of telephone calls made per 8-hour shift is the same for the telemarketers at her three call centers (Austin, Las Vegas, and Albuquerque).A simple random sample of 6 telemarketers from each of the three call centers was taken and the number of telephone calls made in eight hours by each observed employee is shown below.  a. Using = .10, test for any significant difference in number of telephone calls made at the three call centers.
b. Apply Fisher's least significant difference (LSD) procedure to determine where the differences occur. Use = .05.
a. Using = .10, test for any significant difference in number of telephone calls made at the three call centers.
b. Apply Fisher's least significant difference (LSD) procedure to determine where the differences occur. Use = .05.
(Essay)
4.8/5 (26)
The process of allocating the total sum of squares and degrees of freedom is called
(Multiple Choice)
4.8/5 (35)
Exhibit 13-7
The following is part of an ANOVA table, which was the results of three treatments and a total of 15 observations.
-Refer to Exhibit 13-7. The number of degrees of freedom corresponding to within treatments is
(Multiple Choice)
4.8/5 (38)
Filters
- Essay(0)
- Multiple Choice(0)
- Short Answer(0)
- True False(0)
- Matching(0)