Exam 14: Simple Linear Regression
Exam 1: Data and Statistics85 Questions
Exam 2: Descriptive Statistics: Tabular and Graphical Displays112 Questions
Exam 3: Descriptive Statistics: Numerical Measures139 Questions
Exam 4: Introduction to Probability129 Questions
Exam 5: Discrete Probability Distributions150 Questions
Exam 6: Continuous Probability Distributions144 Questions
Exam 7: Sampling and Sampling Distributions119 Questions
Exam 8: Interval Estimation118 Questions
Exam 9: Hypothesis Tests118 Questions
Exam 10: Inference About Means and Proportions With Two Populations127 Questions
Exam 11: Inferences About Population Variances113 Questions
Exam 12: Tests of Goodness of Fit, Independence and Multiple Proportions76 Questions
Exam 13: Experimental Design and Analysis of Variance125 Questions
Exam 14: Simple Linear Regression103 Questions
Exam 15: Multiple Regression109 Questions
Exam 16: Regression Analysis: Model Building82 Questions
Exam 17: Time Series Analysis and Forecasting80 Questions
Exam 18: Nonparametric Methods83 Questions
Exam 19: Statistical Methods for Quality Control75 Questions
Exam 20: Decision Analysis71 Questions
Exam 21: Sample Survey68 Questions
Select questions type
In a regression analysis if SSE = 500 and SSR = 300, then the coefficient of determination is
Free
(Multiple Choice)
4.8/5  (42)
(42)
Correct Answer: Verified
D
Exhibit 14-6
You are given the following information about y and x.  -Given below are seven observations collected in a regression study on two variables, x (independent variable) and y (dependent variable). Use Excel to develop a scatter diagram and to compute the least squares estimated regression equation and the coefficient of determination.
Free
(Essay)
4.9/5 (38)
Correct Answer:Verified
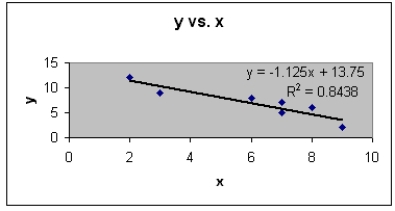
Exhibit 14-1
A regression analysis resulted in the following information regarding a dependent variable (y) and an independent variable (x).  -Refer to Exhibit 14-1. The sample correlation coefficient equals
Free
(Multiple Choice)
4.7/5 (31)
Correct Answer:Verified
B
Regression analysis was applied between sales (in $1,000) and advertising (in $100), and the following regression function was obtained.  = 80 + 6.2x Based on the above estimated regression line, if advertising is $10,000, then the point estimate for sales (in dollars) is
(Multiple Choice)
4.9/5 (37)
Exhibit 14-3
Regression analysis was applied between sales data (in $1,000s) and advertising data (in $100s) and the following information was obtained.  -Refer to Exhibit 14-3. The critical F value at = 0.05 is
(Multiple Choice)
4.9/5 (35)
Exhibit 14-3
Regression analysis was applied between sales data (in $1,000s) and advertising data (in $100s) and the following information was obtained.
-Refer to Exhibit 14-3. Using = 0.05, the critical t value for testing the significance of the slope is
(Multiple Choice)
4.9/5 (42)
Exhibit 14-6
You are given the following information about y and x.
-A company has recorded data on the daily demand for its product (y in thousands of units) and the unit price (x in hundreds of dollars). A sample of 15 days demand and associated prices resulted in the following data.  a.Using the above information, develop the least-squares estimated regression line and write the equation.
b.Compute the coefficient of determination.
c.Perform an F test and determine whether or not there is a significant relationship between demand and unit price. Let = 0.05.
d.Would the demand ever reach zero? If yes, at what price would the demand be zero?
a.Using the above information, develop the least-squares estimated regression line and write the equation.
b.Compute the coefficient of determination.
c.Perform an F test and determine whether or not there is a significant relationship between demand and unit price. Let = 0.05.
d.Would the demand ever reach zero? If yes, at what price would the demand be zero?
(Essay)
4.9/5 (24)
If the coefficient of correlation is 0.4, the percentage of variation in the dependent variable explained by the estimated regression equation
(Multiple Choice)
4.8/5 (32)
Exhibit 14-5
You are given the following information about y and x.  -Refer to Exhibit 14-5. The least squares estimate of b0 (intercept) equals
(Multiple Choice)
4.9/5 (28)
Exhibit 14-5
You are given the following information about y and x.
-Refer to Exhibit 14-5. The sample correlation coefficient equals
(Multiple Choice)
4.9/5 (41)
Exhibit 14-6
You are given the following information about y and x.
-A company has recorded data on the weekly sales for its product (y) and the unit price of the competitor's product (x). The data resulting from a random sample of 7 weeks follows. Use Excel to develop a scatter diagram and to compute the least squares estimated regression equation and the coefficient of determination. 
(Essay)
4.9/5 (30)
Exhibit 14-2
You are given the following information about y and x.  -Refer to Exhibit 14-2. The coefficient of determination equals
(Multiple Choice)
4.7/5 (32)
Exhibit 14-6
You are given the following information about y and x.
-Assume you have noted the following prices for books and the number of pages that each book contains.  a.Develop a least-squares estimated regression line.
b.Compute the coefficient of determination and explain its meaning.
c.Compute the correlation coefficient between the price and the number of pages. Test to see if x and y are related. Use = 0.10.
a.Develop a least-squares estimated regression line.
b.Compute the coefficient of determination and explain its meaning.
c.Compute the correlation coefficient between the price and the number of pages. Test to see if x and y are related. Use = 0.10.
(Essay)
4.9/5 (34)
In regression analysis, the variable that is being predicted is the
(Multiple Choice)
4.8/5 (38)
If a data set has SST = 2,000 and SSE = 800, then the coefficient of determination is
(Multiple Choice)
4.8/5 (32)
If the coefficient of correlation is a negative value, then the coefficient of determination
(Multiple Choice)
4.8/5 (25)
Exhibit 14-6
You are given the following information about y and x.
-Refer to Exhibit 14-6. The coefficient of determination equals
(Multiple Choice)
4.8/5 (39)
Filters
- Essay(0)
- Multiple Choice(0)
- Short Answer(0)
- True False(0)
- Matching(0)