Exam 3: Where Prices Come From: the Interaction of Demand and Supply
Exam 1: Economics: Foundations and Models444 Questions
Exam 2: Trade-Offs, Comparative Advantage, and the Market System498 Questions
Exam 3: Where Prices Come From: the Interaction of Demand and Supply475 Questions
Exam 4: Economic Efficiency, Government Price Setting, and Taxes419 Questions
Exam 5: Externalities, Environmental Policy, and Public Goods266 Questions
Exam 6: Elasticity: the Responsiveness of Demand and Supply295 Questions
Exam 7: The Economics of Health Care334 Questions
Exam 8: Firms, the Stock Market, and Corporate Governance278 Questions
Exam 9: Comparative Advantage and the Gains From International Trade379 Questions
Exam 10: Consumer Choice and Behavioral Economics302 Questions
Exam 11: Technology, Production, and Costs330 Questions
Exam 12: Firms in Perfectly Competitive Markets298 Questions
Exam 13: Monopolistic Competition: the Competitive Model in a More Realistic Setting276 Questions
Exam 14: Oligopoly: Firms in Less Competitive Markets262 Questions
Exam 15: Monopoly and Antitrust Policy271 Questions
Exam 16: Pricing Strategy263 Questions
Exam 17: The Markets for Labor and Other Factors of Production286 Questions
Exam 18: Public Choice, Taxes, and the Distribution of Income258 Questions
Exam 19: GDP: Measuring Total Production and Income266 Questions
Exam 20: Unemployment and Inflation292 Questions
Exam 21: Economic Growth, the Financial System, and Business Cycles257 Questions
Exam 22: Long-Run Economic Growth: Sources and Policies268 Questions
Exam 23: Aggregate Expenditure and Output in the Short Run306 Questions
Exam 24: Aggregate Demand and Aggregate Supply Analysis284 Questions
Exam 25: Money, Banks, and the Federal Reserve System280 Questions
Exam 26: Monetary Policy277 Questions
Exam 27: Fiscal Policy303 Questions
Exam 28: Inflation, Unemployment, and Federal Reserve Policy257 Questions
Exam 29: Macroeconomics in an Open Economy278 Questions
Exam 30: The International Financial System262 Questions
Select questions type
If, in the market for oranges, the supply has increased then
(Multiple Choice)
4.9/5  (35)
(35)
In 2004, hurricanes damaged a large portion of Florida's orange crop. As a result of this, many orange growers were not able to supply fruit to the market. At the pre-hurricane equilibrium price (i.e., at the initial equilibrium price), we would expect to see
(Multiple Choice)
4.8/5 (29)
By drawing a demand curve with price on the vertical axis and quantity on the horizontal axis, economists assume that the most important determinant of the demand for a good is
(Multiple Choice)
4.8/5 (36)
If the price of a product is expected to increase in the future, the supply today will increase.
(True/False)
4.8/5 (32)
As the number of firms in a market decreases, the supply curve will shift to the left and the equilibrium price will fall.
(True/False)
4.8/5 (32)
Figure 3-6 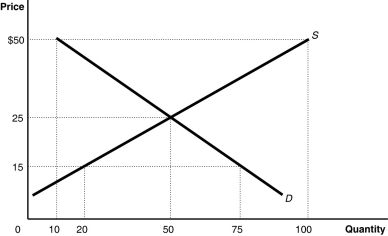 -Auctions in recent years have resulted in higher prices paid for letters written by John Wilkes Booth than those written by Abraham Lincoln. Which of the following events would cause the price differences in these letters to get smaller?
(Multiple Choice)
4.8/5 (37)
A firm has an incentive to decrease supply now and increase supply in the future if it expects that
(Multiple Choice)
4.7/5 (35)
For each of the following pairs of products state which are complements, which are substitutes, and which are unrelated.
a. Swim fins and scuba tanks
b. Coca Cola and Volkswagens
c. Printers and ink cartridges
d. Ice and ice chests
e. Heineken and Corona
(Essay)
4.9/5 (24)
Figure 3-1 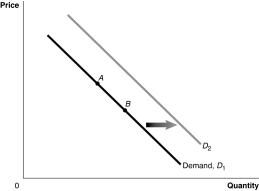 -Refer to Figure 3-1. A decrease population would be represented by a movement from
(Multiple Choice)
4.9/5 (35)
As the number of firms in a market increases, the supply curve will shift to the left and the equilibrium price will rise.
(True/False)
4.9/5 (35)
As the number of firms in a market increases, the supply curve will shift to the right and the equilibrium quantity will rise.
(True/False)
4.8/5 (32)
If the number of firms producing mouthwash increases and consumer preference for mouthwash increases, the equilibrium price of mouthwash will definitely increase.
(True/False)
4.9/5 (41)
When Toyota introduced its 2010 Prius, it announced that the average retail price of the 2010 model would be lower than the average retail price was for the equivalent 2009 model. Which of the following would explain the price differential?
(Multiple Choice)
4.9/5 (31)
A change in quantity supplied is represented by a movement along the supply curve.
(True/False)
4.9/5 (23)
According to the Australian Wool Innovation, severe drought conditions in Australia contributed to the lowest level of wool production in 50 years. This record low production has driven up prices sharply in Australian wool markets. Meanwhile, the price of raw cotton increased significantly for the first time in many years.
a. Illustrate this observation with one demand and supply graph for the market for Australian wool and another demand and supply graph for raw cotton.
b. Make sure that your graphs clearly show (1) the initial equilibrium before the decrease in the supply of Australian wool and (2) the final equilibrium.
c. Use arrows to indicate any shifts in the demand and supply curves for each market.
d. Label your graphs fully and write an explanation of your work.
(Essay)
4.8/5 (37)
Figure 3-1
-Refer to Figure 3-1. A decrease in the expected future price of the product would be represented by a movement from
(Multiple Choice)
4.9/5 (43)
Filters
- Essay(0)
- Multiple Choice(0)
- Short Answer(0)
- True False(0)
- Matching(0)