Exam 3: Where Prices Come From: the Interaction of Demand and Supply
Exam 1: Economics: Foundations and Models444 Questions
Exam 2: Trade-Offs, Comparative Advantage, and the Market System498 Questions
Exam 3: Where Prices Come From: the Interaction of Demand and Supply475 Questions
Exam 4: Economic Efficiency, Government Price Setting, and Taxes419 Questions
Exam 5: Externalities, Environmental Policy, and Public Goods266 Questions
Exam 6: Elasticity: the Responsiveness of Demand and Supply295 Questions
Exam 7: The Economics of Health Care334 Questions
Exam 8: Firms, the Stock Market, and Corporate Governance278 Questions
Exam 9: Comparative Advantage and the Gains From International Trade379 Questions
Exam 10: Consumer Choice and Behavioral Economics302 Questions
Exam 11: Technology, Production, and Costs330 Questions
Exam 12: Firms in Perfectly Competitive Markets298 Questions
Exam 13: Monopolistic Competition: the Competitive Model in a More Realistic Setting276 Questions
Exam 14: Oligopoly: Firms in Less Competitive Markets262 Questions
Exam 15: Monopoly and Antitrust Policy271 Questions
Exam 16: Pricing Strategy263 Questions
Exam 17: The Markets for Labor and Other Factors of Production286 Questions
Exam 18: Public Choice, Taxes, and the Distribution of Income258 Questions
Exam 19: GDP: Measuring Total Production and Income266 Questions
Exam 20: Unemployment and Inflation292 Questions
Exam 21: Economic Growth, the Financial System, and Business Cycles257 Questions
Exam 22: Long-Run Economic Growth: Sources and Policies268 Questions
Exam 23: Aggregate Expenditure and Output in the Short Run306 Questions
Exam 24: Aggregate Demand and Aggregate Supply Analysis284 Questions
Exam 25: Money, Banks, and the Federal Reserve System280 Questions
Exam 26: Monetary Policy277 Questions
Exam 27: Fiscal Policy303 Questions
Exam 28: Inflation, Unemployment, and Federal Reserve Policy257 Questions
Exam 29: Macroeconomics in an Open Economy278 Questions
Exam 30: The International Financial System262 Questions
Select questions type
Table 3-2
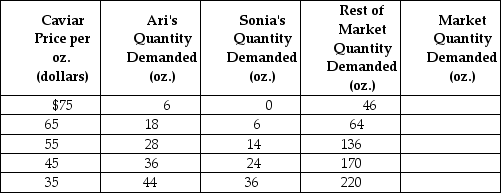 -Refer to Table 3-2. The table above shows the demand schedules for caviar of two individuals (Ari and Sonia) and the rest of the market. If the price of caviar falls from $45 to $35, the market quantity demanded would
(Multiple Choice)
4.8/5  (32)
(32)
A decrease in the number of firms in a market will cause supply to increase.
(True/False)
4.8/5 (32)
Let D = demand, S = supply, P = equilibrium price, Q = equilibrium quantity. What happens in the market for solar panels if the government offers tax breaks to encourage manufacturers to produce more solar panels?
(Multiple Choice)
4.9/5 (33)
The law of demand implies, holding everything else constant, that as the price of gelato
(Multiple Choice)
4.8/5 (37)
Figure 3-1 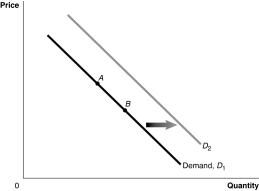 -Refer to Figure 3-1. If the product represented is a normal good, an increase in income would be represented by a movement from
(Multiple Choice)
4.8/5 (26)
Figure 3-2 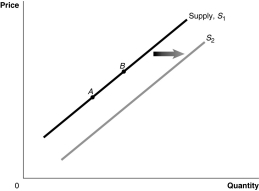 -Refer to Figure 3-2. A decrease in the price of the product would be represented by a movement from
(Multiple Choice)
4.9/5 (32)
Figure 3-8 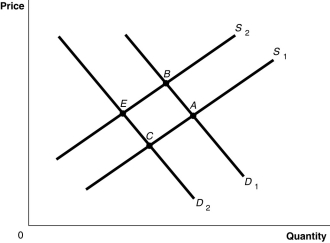 -Refer to Figure 3-8. The graph in this figure illustrates an initial competitive equilibrium in the market for motorcycles at the intersection of D2 and S1 (point
(Multiple Choice)
4.7/5 (28)
Figure 3-8
-Refer to Figure 3-8. The graph in this figure illustrates an initial competitive equilibrium in the market for apples at the intersection of D2 and S2 (point
(Multiple Choice)
4.8/5 (37)
Prices of smartphones (assume that this is a normal good) have fallen in recent years. Over this same period, the price of the components used to produce smartphones has also fallen and consumer incomes have risen. Which of the following best explains the falling prices of smartphones?
(Multiple Choice)
4.8/5 (38)
If an increase in income leads to in an increase in the demand for peanut butter, then peanut butter is
(Multiple Choice)
4.8/5 (29)
Table 3-4
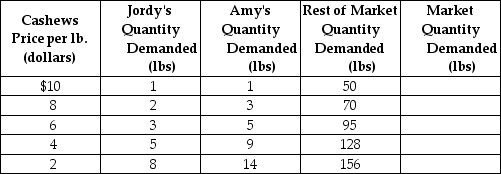 -Refer to Table 3-4. The table above shows the demand schedules for cashews of two individuals (Jordy and Amy) and the rest of the market. At a price of $6, the quantity demanded in the market would be
(Multiple Choice)
4.9/5 (39)
Figure 3-8
-Refer to Figure 3-8. The graph in this figure illustrates an initial competitive equilibrium in the market for sugar at the intersection of D1 and S2 (point
(Multiple Choice)
4.7/5 (34)
Figure 3-7 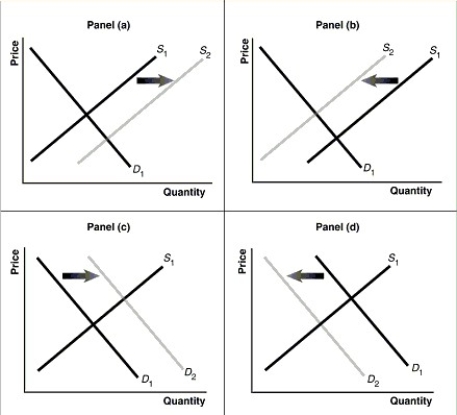 -Refer to Figure 3-7. Assume that the graphs in this figure represent the demand and supply curves for potatoes and that steak and potatoes are complements. Which panel describes what happens in this market when the price of steak rises?
(Multiple Choice)
4.8/5 (37)
Figure 3-7
-Refer to Figure 3-7. Assume that the graphs in this figure represent the demand and supply curves for laptop computers. Which panel best describes what happens in this market when the price of computer hard drives falls?
(Multiple Choice)
4.9/5 (39)
If the price of a product is above equilibrium, what forces it down?
(Essay)
4.9/5 (40)
Which of the following will shift the demand curve for a good?
(Multiple Choice)
4.8/5 (36)
An increase in the equilibrium quantity of a product will result
(Multiple Choice)
4.7/5 (32)
If the demand for a product increases and the supply of the same product increases, the equilibrium price will increase.
(True/False)
4.9/5 (29)
Filters
- Essay(0)
- Multiple Choice(0)
- Short Answer(0)
- True False(0)
- Matching(0)