Exam 3: Where Prices Come From: the Interaction of Demand and Supply
Exam 1: Economics: Foundations and Models444 Questions
Exam 2: Trade-Offs, Comparative Advantage, and the Market System498 Questions
Exam 3: Where Prices Come From: the Interaction of Demand and Supply475 Questions
Exam 4: Economic Efficiency, Government Price Setting, and Taxes419 Questions
Exam 5: Externalities, Environmental Policy, and Public Goods266 Questions
Exam 6: Elasticity: the Responsiveness of Demand and Supply295 Questions
Exam 7: The Economics of Health Care334 Questions
Exam 8: Firms, the Stock Market, and Corporate Governance278 Questions
Exam 9: Comparative Advantage and the Gains From International Trade379 Questions
Exam 10: Consumer Choice and Behavioral Economics302 Questions
Exam 11: Technology, Production, and Costs330 Questions
Exam 12: Firms in Perfectly Competitive Markets298 Questions
Exam 13: Monopolistic Competition: the Competitive Model in a More Realistic Setting276 Questions
Exam 14: Oligopoly: Firms in Less Competitive Markets262 Questions
Exam 15: Monopoly and Antitrust Policy271 Questions
Exam 16: Pricing Strategy263 Questions
Exam 17: The Markets for Labor and Other Factors of Production286 Questions
Exam 18: Public Choice, Taxes, and the Distribution of Income258 Questions
Exam 19: GDP: Measuring Total Production and Income266 Questions
Exam 20: Unemployment and Inflation292 Questions
Exam 21: Economic Growth, the Financial System, and Business Cycles257 Questions
Exam 22: Long-Run Economic Growth: Sources and Policies268 Questions
Exam 23: Aggregate Expenditure and Output in the Short Run306 Questions
Exam 24: Aggregate Demand and Aggregate Supply Analysis284 Questions
Exam 25: Money, Banks, and the Federal Reserve System280 Questions
Exam 26: Monetary Policy277 Questions
Exam 27: Fiscal Policy303 Questions
Exam 28: Inflation, Unemployment, and Federal Reserve Policy257 Questions
Exam 29: Macroeconomics in an Open Economy278 Questions
Exam 30: The International Financial System262 Questions
Select questions type
In 2004, hurricanes destroyed a large portion of Florida's grapefruit crop. How did this affect the market price and market quantity of grapefruit?
(Essay)
4.9/5  (34)
(34)
If an increase in income leads to a decrease in the demand for salami, then salami is
(Multiple Choice)
4.8/5 (37)
Figure 3-1 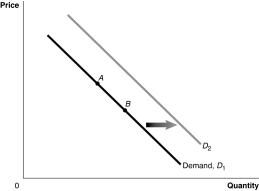 -Refer to Figure 3-1. If the product represented is a normal good, a decrease in income would be represented by a movement from
(Multiple Choice)
4.8/5 (30)
Digital video recorders (DVRs) were introduced to the market in 1999, and new technology has allowed for the cost of manufacturing the recorders to decline significantly since the initial introduction. How did this change in technology affect the market for DVRs?
(Multiple Choice)
4.9/5 (44)
The ________ effect of a price change refers to the impact of a change in the price of a good on a consumer's purchasing power.
(Multiple Choice)
4.8/5 (33)
If in the market for apples the supply has decreased, then
(Multiple Choice)
4.8/5 (39)
Farmers can plant either corn or soybeans in their fields. Which of the following would cause the supply of soybeans to increase?
(Multiple Choice)
4.8/5 (38)
Figure 3-6 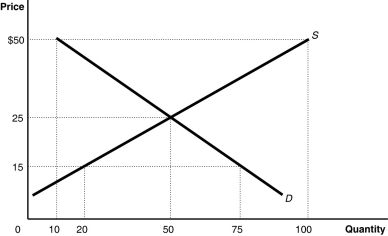 -Which of the following is evidence of a surplus of bananas?
(Multiple Choice)
4.8/5 (28)
Figure 3-8 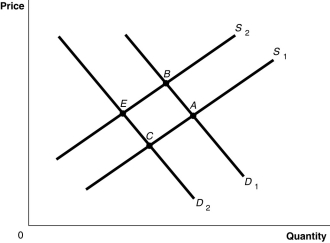 -Refer to Figure 3-8. The graph in this figure illustrates an initial competitive equilibrium in the market for apples at the intersection of D1 and S2 (point
(Multiple Choice)
4.8/5 (27)
Holding everything else constant, a decrease in the price of bicycles will result in
(Multiple Choice)
4.7/5 (40)
What are the five most important variables that shift the market supply curve?
(Essay)
5.0/5 (35)
Figure 3-4 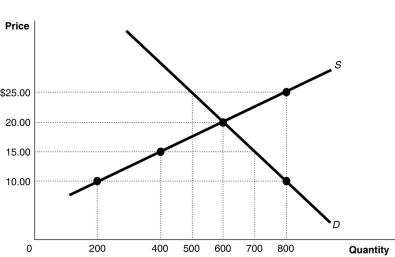 -Refer to Figure 3-4. If the current market price is $15, the market will achieve equilibrium by
(Multiple Choice)
4.8/5 (27)
If the price of pork rinds falls, the substitution effect due to the price change will cause
(Multiple Choice)
4.8/5 (34)
Draw a demand curve and label it D1. On the graph, illustrate an increase in demand and a decrease in demand, and label the curves D2 and D3, respectively. Starting on demand curve D1, explain the shift that would result from each of the following events:
a. an increase in income and the good is a normal good
b. an increase in income and the good is an inferior good
c. a decrease in the price of a substitute good
d. a decrease in the price of a complementary good
e. an increase in the taste for the good
f. a decrease in population
g. an increase in the expected future price of the good
(Essay)
4.8/5 (28)
The demand for soft drinks in the United States has been ________ while the global demand has been ________.
(Multiple Choice)
4.7/5 (32)
Explain the differences between a change in supply and a change in quantity supplied.
(Essay)
4.8/5 (35)
Which of the following would cause an increase in the equilibrium price and decrease in the equilibrium quantity of watermelon?
(Multiple Choice)
4.9/5 (38)
If, in response to a decrease in the price of coffee, the quantity demanded of coffee increases, economists would describe this as
(Multiple Choice)
4.8/5 (38)
A decrease in quantity supplied is represented by a leftward shift of the supply curve.
(True/False)
4.9/5 (36)
Figure 3-2 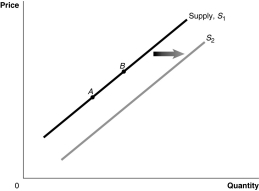 -Refer to Figure 3-2. A decrease in the number of firms in the market would be represented by a movement from
(Multiple Choice)
4.8/5 (37)
Filters
- Essay(0)
- Multiple Choice(0)
- Short Answer(0)
- True False(0)
- Matching(0)