Exam 18: Public Choice, Taxes, and the Distribution of Income
Exam 1: Economics: Foundations and Models444 Questions
Exam 2: Trade-Offs, Comparative Advantage, and the Market System498 Questions
Exam 3: Where Prices Come From: the Interaction of Demand and Supply475 Questions
Exam 4: Economic Efficiency, Government Price Setting, and Taxes419 Questions
Exam 5: Externalities, Environmental Policy, and Public Goods266 Questions
Exam 6: Elasticity: the Responsiveness of Demand and Supply295 Questions
Exam 7: The Economics of Health Care334 Questions
Exam 8: Firms, the Stock Market, and Corporate Governance278 Questions
Exam 9: Comparative Advantage and the Gains From International Trade379 Questions
Exam 10: Consumer Choice and Behavioral Economics302 Questions
Exam 11: Technology, Production, and Costs330 Questions
Exam 12: Firms in Perfectly Competitive Markets298 Questions
Exam 13: Monopolistic Competition: the Competitive Model in a More Realistic Setting276 Questions
Exam 14: Oligopoly: Firms in Less Competitive Markets262 Questions
Exam 15: Monopoly and Antitrust Policy271 Questions
Exam 16: Pricing Strategy263 Questions
Exam 17: The Markets for Labor and Other Factors of Production286 Questions
Exam 18: Public Choice, Taxes, and the Distribution of Income258 Questions
Exam 19: GDP: Measuring Total Production and Income266 Questions
Exam 20: Unemployment and Inflation292 Questions
Exam 21: Economic Growth, the Financial System, and Business Cycles257 Questions
Exam 22: Long-Run Economic Growth: Sources and Policies268 Questions
Exam 23: Aggregate Expenditure and Output in the Short Run306 Questions
Exam 24: Aggregate Demand and Aggregate Supply Analysis284 Questions
Exam 25: Money, Banks, and the Federal Reserve System280 Questions
Exam 26: Monetary Policy277 Questions
Exam 27: Fiscal Policy303 Questions
Exam 28: Inflation, Unemployment, and Federal Reserve Policy257 Questions
Exam 29: Macroeconomics in an Open Economy278 Questions
Exam 30: The International Financial System262 Questions
Select questions type
Table 18-6
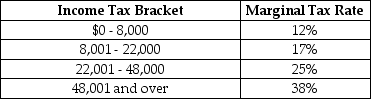 Table 18-6 shows the income tax brackets and tax rates for single taxpayers in Calpernia.
-Refer to Table 18-6. Sasha is a single taxpayer with an income of $60,000. What is his marginal tax rate and what is his average tax rate?
Table 18-6 shows the income tax brackets and tax rates for single taxpayers in Calpernia.
-Refer to Table 18-6. Sasha is a single taxpayer with an income of $60,000. What is his marginal tax rate and what is his average tax rate?
(Multiple Choice)
4.8/5  (37)
(37)
If the marginal tax rate is greater than the average tax rate, the tax structure is described as regressive.
(True/False)
4.8/5 (34)
When the majority of voters have preferences very different from those of the median voter, then the median voter theorem will lead to accurate predictions of the outcomes of elections.
(True/False)
4.9/5 (34)
Figure 18-6 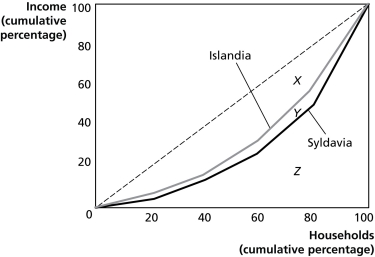 Figure 18-6 shows the Lorenz curves for Islandia and Syldavia.
-Refer to Figure 18-6. If area X = 2,060, area Y = 240, and area Z = 2,700, calculate the Gini coefficient for Islandia.
Figure 18-6 shows the Lorenz curves for Islandia and Syldavia.
-Refer to Figure 18-6. If area X = 2,060, area Y = 240, and area Z = 2,700, calculate the Gini coefficient for Islandia.
(Multiple Choice)
4.8/5 (39)
Figure 18-2 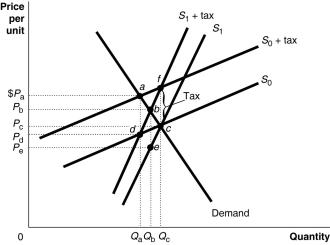 Figure 18-2 shows a demand curve and two sets of supply curves, one set more elastic than the other.
-Refer to Figure 18-2. If the government imposes an excise tax of $1.00 on every unit sold, the government's revenue from the tax
Figure 18-2 shows a demand curve and two sets of supply curves, one set more elastic than the other.
-Refer to Figure 18-2. If the government imposes an excise tax of $1.00 on every unit sold, the government's revenue from the tax
(Multiple Choice)
5.0/5 (40)
Suppose, on average, a family in Church Falls earning $60,000 per year paid 6 percent of its income in state taxes. A family earning $80,000 paid, on average, $4,760 in state income taxes. Are state taxes in Church Falls progressive or regressive? Be sure to explain the difference between a progressive tax and a regressive tax.
(Essay)
4.8/5 (29)
Figure 18-1 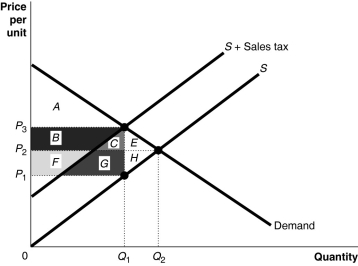 -Refer to Figure 18-1. The excess burden of the tax is represented by the area
(Multiple Choice)
4.8/5 (30)
In the United States, taxpayers are allowed to exclude from taxation a certain amount of income, called
(Multiple Choice)
4.8/5 (34)
Figure 18-2 Figure 18-2 shows a demand curve and two sets of supply curves, one set more elastic than the other.
-Refer to Figure 18-2. If the government imposes an excise tax of $1.00 on every unit sold, the government's revenue from the tax is represented by the area
(Multiple Choice)
4.7/5 (38)
In the United States, over the past 40 years federal revenues as a share of gross domestic product have
(Multiple Choice)
5.0/5 (39)
The public choice model can be used to examine voting models that contrast the manner in which collective decisions are made by governments (state, local and federal) and the manner in which individual choices are made in markets. Which of the following descriptions is consistent with the difference between collective decision making and decision making in markets?
(Multiple Choice)
4.7/5 (40)
Which of the following tax systems would help reduce income inequality the most?
(Multiple Choice)
4.8/5 (34)
The median voter theorem will be an accurate predicator of the outcomes of elections
(Multiple Choice)
4.9/5 (40)
Figure 18-2 Figure 18-2 shows a demand curve and two sets of supply curves, one set more elastic than the other.
-Refer to Figure 18-2. If the government imposes an excise tax of $1.00 on every unit sold, the consumer's burden of the tax
(Multiple Choice)
4.8/5 (33)
Table 18-2
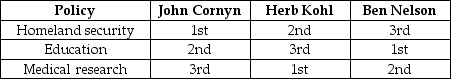 -Refer to Table 18-2. The table above lists three policy alternatives that the U.S. Senate will vote on, along with the ranking of these alternates. The Senate must decide which of these alternatives should receive an additional $1 billion of funding, and there is enough money in the federal budget for only one of these alternatives. If a series of votes is taken in which each pair of alternatives is considered (homeland security and education; homeland security and medical research; education and medical research) which of the following will result from these votes?
(Multiple Choice)
4.9/5 (24)
Since lower-income people spend a larger proportion of their incomes on groceries than do higher-income people, if grocery stores were required by law to charge a 10-cent fee for disposable bags, this fee could be considered
(Multiple Choice)
4.8/5 (39)
Figure 18-6 Figure 18-6 shows the Lorenz curves for Islandia and Syldavia.
-Refer to Figure 18-6. If area X = 2,060, area Y = 240, and area Z= 2,700, calculate the Gini coefficient for Syldavia.
(Multiple Choice)
4.8/5 (42)
Figure 18-4 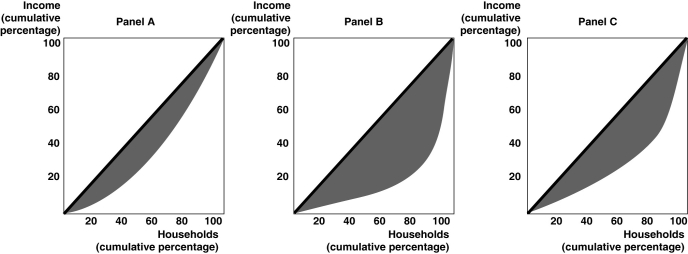 -Suppose the United States has a Gini coefficient of 0.4 and Sweden has a Gini coefficient of 0.25. Which of the following statements is true?
(Multiple Choice)
4.8/5 (37)
Filters
- Essay(0)
- Multiple Choice(0)
- Short Answer(0)
- True False(0)
- Matching(0)