Exam 18: Public Choice, Taxes, and the Distribution of Income
Exam 1: Economics: Foundations and Models444 Questions
Exam 2: Trade-Offs, Comparative Advantage, and the Market System498 Questions
Exam 3: Where Prices Come From: the Interaction of Demand and Supply475 Questions
Exam 4: Economic Efficiency, Government Price Setting, and Taxes419 Questions
Exam 5: Externalities, Environmental Policy, and Public Goods266 Questions
Exam 6: Elasticity: the Responsiveness of Demand and Supply295 Questions
Exam 7: The Economics of Health Care334 Questions
Exam 8: Firms, the Stock Market, and Corporate Governance278 Questions
Exam 9: Comparative Advantage and the Gains From International Trade379 Questions
Exam 10: Consumer Choice and Behavioral Economics302 Questions
Exam 11: Technology, Production, and Costs330 Questions
Exam 12: Firms in Perfectly Competitive Markets298 Questions
Exam 13: Monopolistic Competition: the Competitive Model in a More Realistic Setting276 Questions
Exam 14: Oligopoly: Firms in Less Competitive Markets262 Questions
Exam 15: Monopoly and Antitrust Policy271 Questions
Exam 16: Pricing Strategy263 Questions
Exam 17: The Markets for Labor and Other Factors of Production286 Questions
Exam 18: Public Choice, Taxes, and the Distribution of Income258 Questions
Exam 19: GDP: Measuring Total Production and Income266 Questions
Exam 20: Unemployment and Inflation292 Questions
Exam 21: Economic Growth, the Financial System, and Business Cycles257 Questions
Exam 22: Long-Run Economic Growth: Sources and Policies268 Questions
Exam 23: Aggregate Expenditure and Output in the Short Run306 Questions
Exam 24: Aggregate Demand and Aggregate Supply Analysis284 Questions
Exam 25: Money, Banks, and the Federal Reserve System280 Questions
Exam 26: Monetary Policy277 Questions
Exam 27: Fiscal Policy303 Questions
Exam 28: Inflation, Unemployment, and Federal Reserve Policy257 Questions
Exam 29: Macroeconomics in an Open Economy278 Questions
Exam 30: The International Financial System262 Questions
Select questions type
Figure 18-7 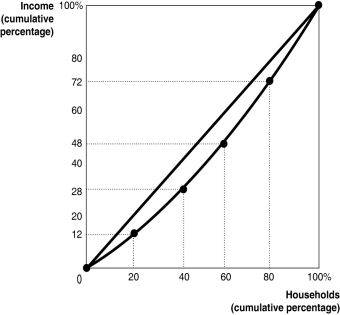 Figure 18-7 shows the Lorenz curve for a hypothetical country.
-Refer to Figure 18-7. The second highest 20 percent of households
Figure 18-7 shows the Lorenz curve for a hypothetical country.
-Refer to Figure 18-7. The second highest 20 percent of households
(Multiple Choice)
4.9/5  (40)
(40)
Figure 18-8 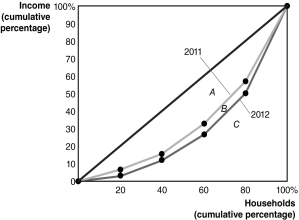 -Refer to Figure 18-8 to answer the following questions.
a. Did the distribution of income become more equal in 2012 than it was in 2011, or did it become less equal? Explain.
b. If area A = 1,900, area B = 450, and area C = 2,650, calculate the Gini coefficient for 2011 and the Gini coefficient for 2012.
-Refer to Figure 18-8 to answer the following questions.
a. Did the distribution of income become more equal in 2012 than it was in 2011, or did it become less equal? Explain.
b. If area A = 1,900, area B = 450, and area C = 2,650, calculate the Gini coefficient for 2011 and the Gini coefficient for 2012.
(Essay)
4.8/5 (33)
Article Summary
In 2012, Colorado and Washington legalized marijuana for recreational use, and one of the major selling points in each state's pro-marijuana campaign was the possibility of generating millions of dollars in tax revenue from sales which could be used for funding general education. The Colorado legislature was weighing a proposal to tax marijuana at 30 percent, of which 15 percent would be a sales tax on consumers and 15 percent an excise tax on growers. Washington has set a tax rate of 44 percent on consumers and 25 percent each for growers and retailers. Since the legalization of marijuana is relatively new, projecting the economic impact of its sale is difficult, leading to many questions as to the quantities that will be produced and sold and what actual tax revenues will be generated.
Source: Elizabeth Dwoskin, "Colorado and Washington Try to Figure Out How to Tax Marijuana," Bloomberg Businessweek, April 26, 2013.
-Refer to the Article Summary. Colorado is weighing a proposal to tax marijuana at 30 percent, of which 15 percent would be a sales tax on consumers and 15 percent would be an excise tax on growers. Does this necessarily mean that each group will bear half the burden of the tax?
(Multiple Choice)
4.8/5 (45)
Most economists agree that some of the burden of the corporate income tax
(Multiple Choice)
4.8/5 (40)
Which of the following is not an example of rent-seeking behavior?
(Multiple Choice)
4.9/5 (35)
If, as your taxable income decreases, you pay a larger percentage of your taxable income in taxes, then the tax is
(Multiple Choice)
4.8/5 (34)
Economists argue that the corporate income tax is an example of a tax with a high deadweight loss because
(Multiple Choice)
4.8/5 (37)
Table 18-9
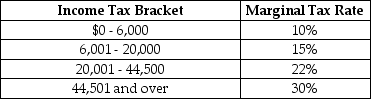 Table 18-9 shows the income tax brackets and tax rates for single taxpayers in Monrovia.
-Refer to Table 18-9. Calculate the income tax paid by Sylvia, a single taxpayer with an income of $70,000.
Table 18-9 shows the income tax brackets and tax rates for single taxpayers in Monrovia.
-Refer to Table 18-9. Calculate the income tax paid by Sylvia, a single taxpayer with an income of $70,000.
(Multiple Choice)
4.9/5 (29)
Figure 18-7 Figure 18-7 shows the Lorenz curve for a hypothetical country.
-Refer to Figure 18-7. The second lowest 20 percent of households
(Multiple Choice)
4.7/5 (29)
How would the elimination of a sales tax affect the market for a product that had been subject to the tax?
(Multiple Choice)
4.9/5 (36)
Figure 18-2 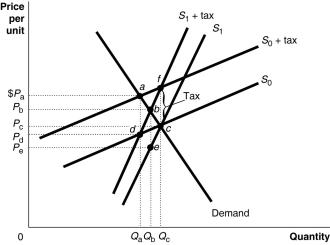 Figure 18-2 shows a demand curve and two sets of supply curves, one set more elastic than the other.
-Refer to Figure 18-2. If the government imposes an excise tax of $1.00 on every unit sold,
Figure 18-2 shows a demand curve and two sets of supply curves, one set more elastic than the other.
-Refer to Figure 18-2. If the government imposes an excise tax of $1.00 on every unit sold,
(Multiple Choice)
4.8/5 (29)
Which of the following is the largest source of revenue for the U.S. federal government?
(Multiple Choice)
4.8/5 (36)
Is a typical person likely to gather more information when buying a new computer or when voting for a member of the U.S. Senate? Why?
(Essay)
4.8/5 (45)
When the demand for a product is more elastic than the supply,
(Multiple Choice)
5.0/5 (34)
Figure 18-1 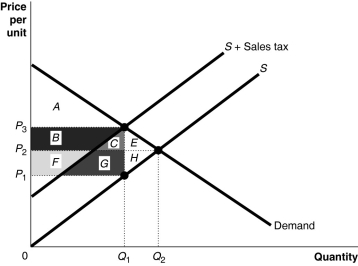 -Refer to Figure 18-1. Area B + C + F + G represents
(Multiple Choice)
4.8/5 (37)
One important difference between the political process and the market process is that
(Multiple Choice)
4.9/5 (37)
Filters
- Essay(0)
- Multiple Choice(0)
- Short Answer(0)
- True False(0)
- Matching(0)